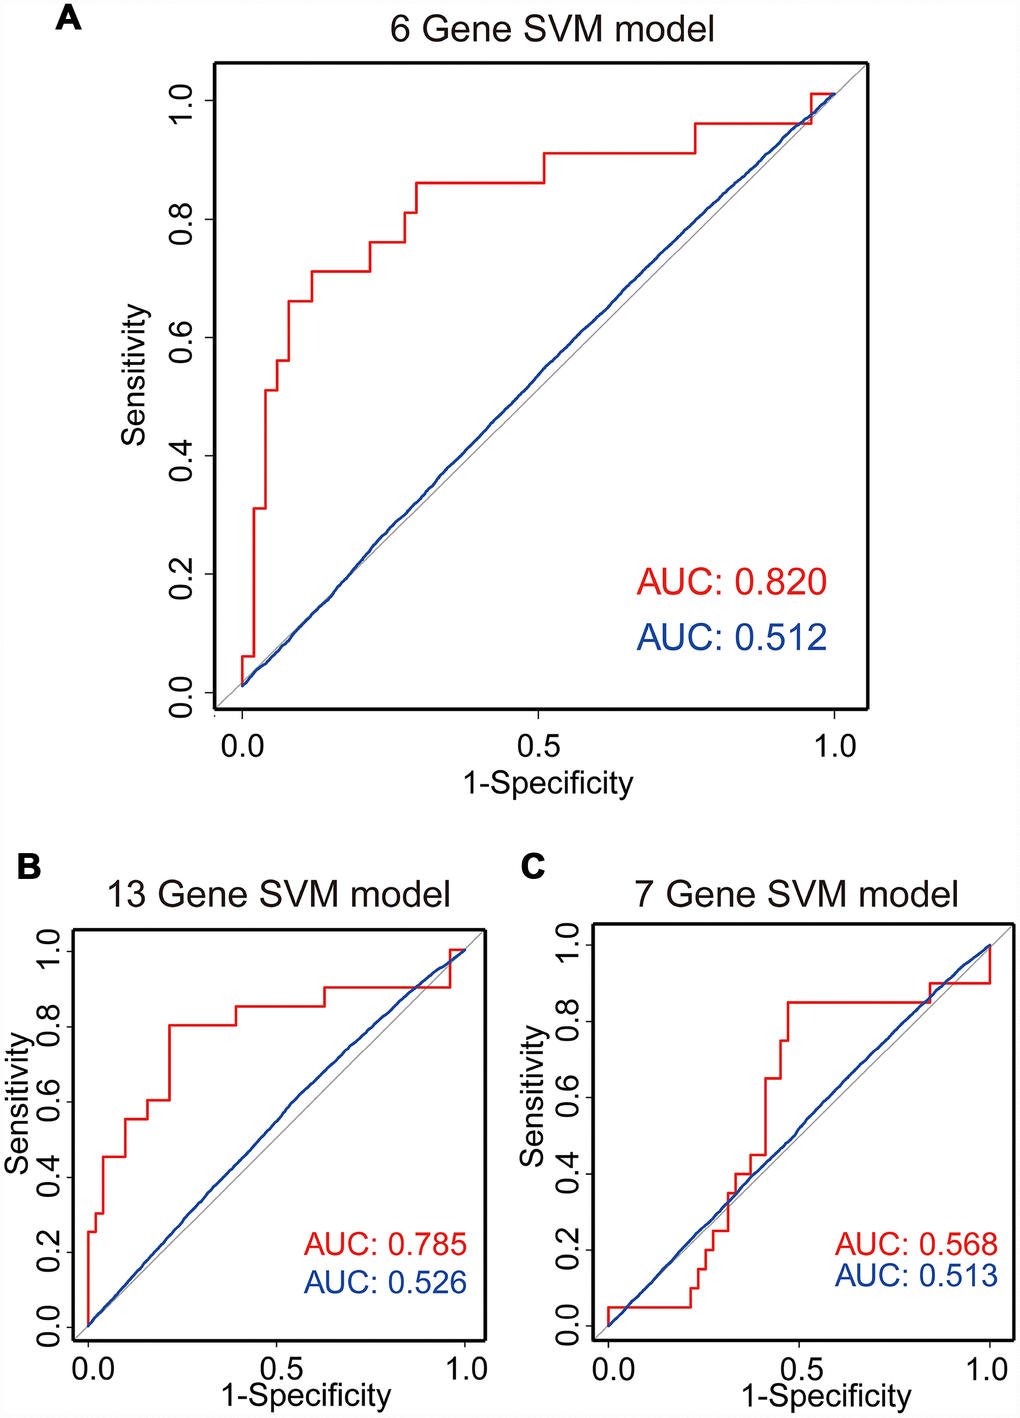
Figure 5.SVM regrowth prediction model. Three ROC curves using LOOCV show the comparisons of the AUC for the prediction of regrowth with 6 genes (A), 13 genes (B) and 7 genes (C). The red line shows the prediction model efficiency, and the blue line shows the permutation p-value of AUC was obtained from 1,000 randomization tests for testing the null hypothesis. The 6-gene model shows a better prediction accuracy.