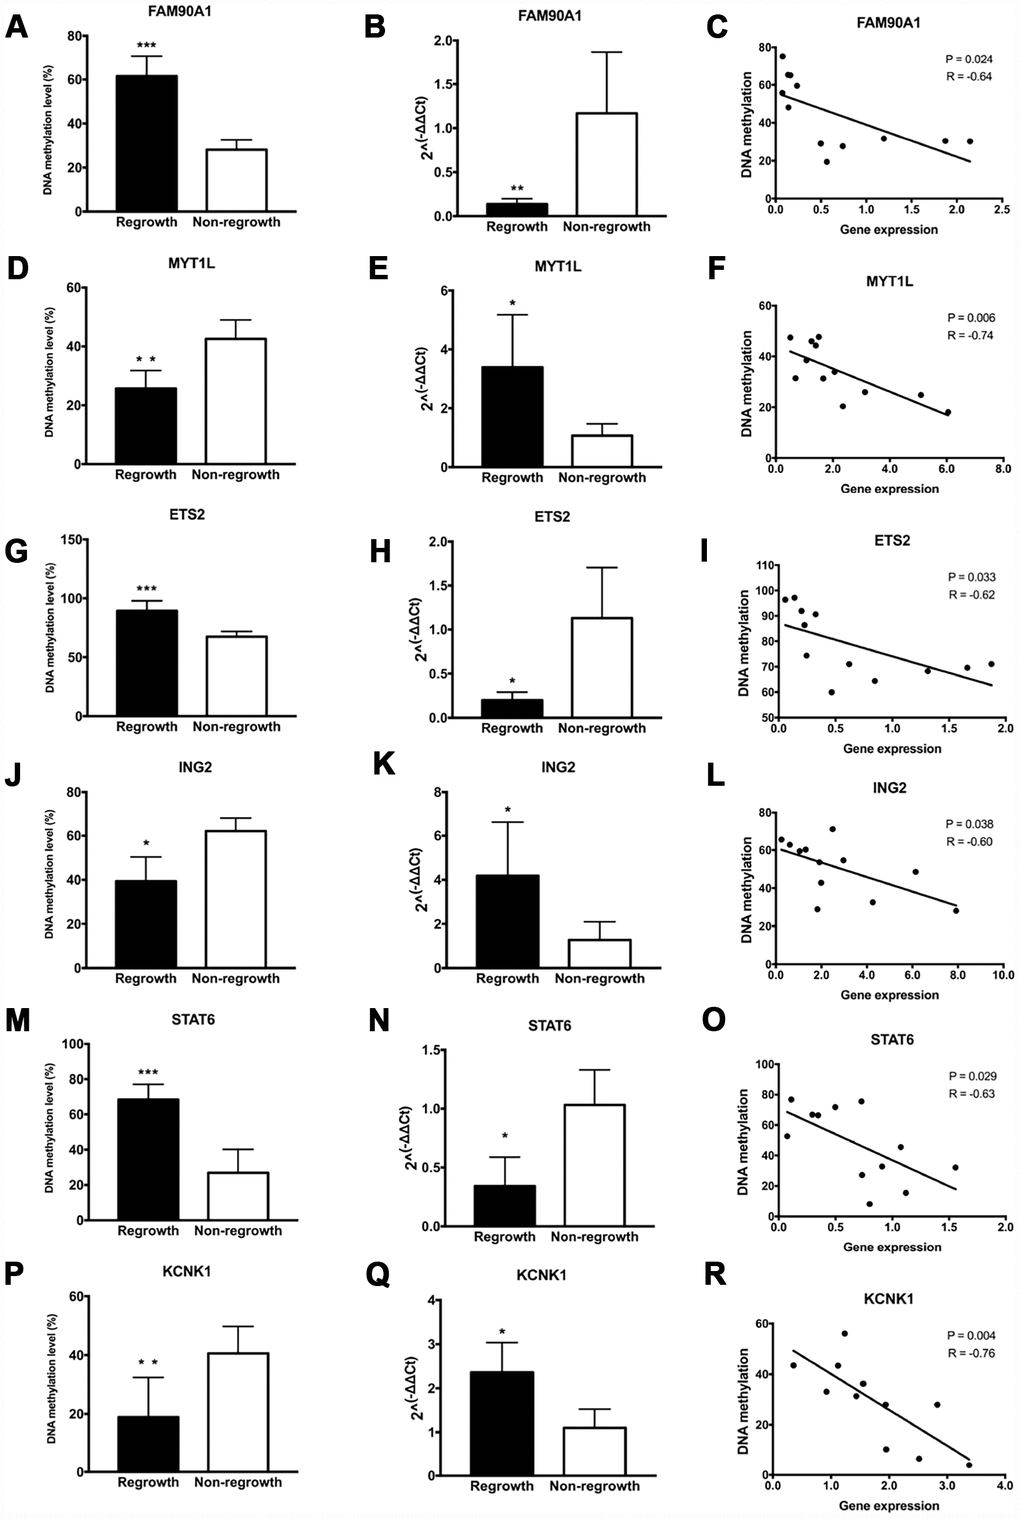
Figure 6.Evaluation of DNA methylation and expression levels of selected genes. The DNA methylation status, expression levels and Pearson correlation of FAM90A1, MYT1L, ETS2, ING2, STAT6, KCNK1 are shown. Each dot represents the average DNA methylation and gene expression level for every sample. * p < 0.05, ** p < 0.01, *** p < 0.001.