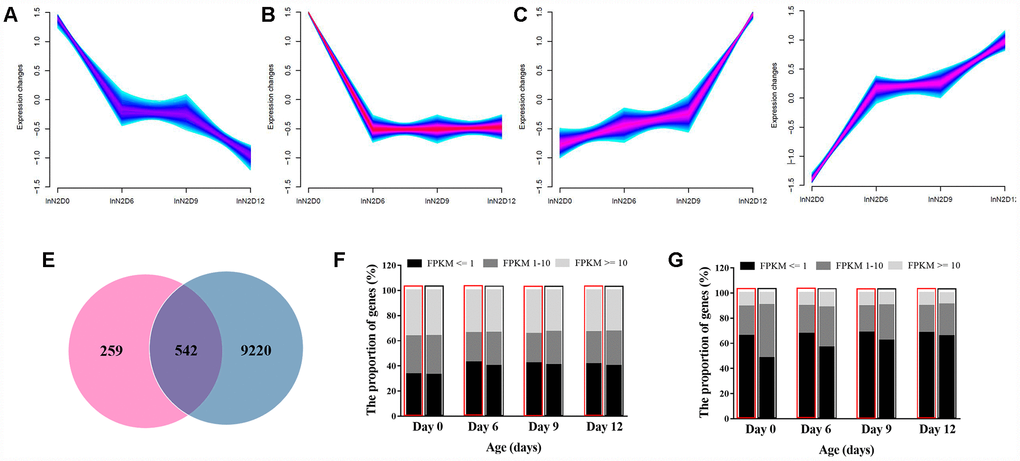
Figure 4.Age-dependent changes in gene expression levels. (A–D) Clusters of genes associated with age. Genes with the same expression pattern were grouped into a cluster. Yellow and green colors correspond to low membership values, while red and purple colors correspond to high membership values. (E) Venn diagram of the differentially expressed genes. Each circle represents a set of genes. The left circles represent the genes associated with mitochondria variation. The right circles represent the genes associated with aging. The region superimposed by circles represent the genes both associated with mitochondria variation and aging. (F) Gene expression features at the whole genome level. High expression, intermediate expression, and low expression are represented by FPKM>=10, FPKM=1~10 and FPKM<=1, respectively. (G) Gene expression features of 920 genes affected by mitochondria polymorphism.