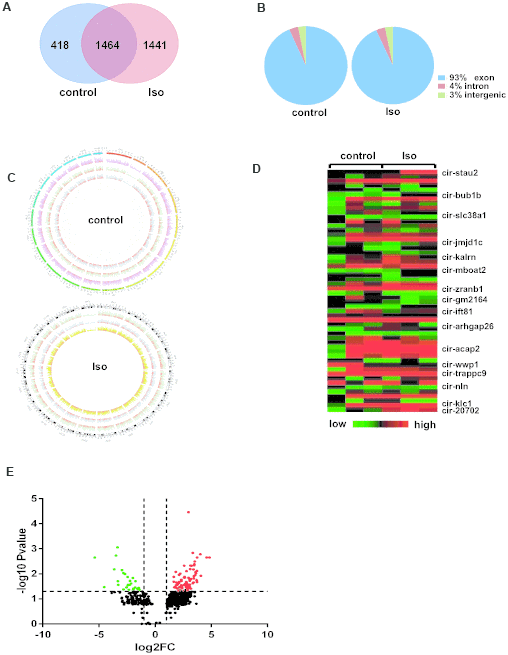
Figure 2.Differentially expressed circRNAs in left ventricles after isoproterenol treatment. (A) Venn diagrams showing the overlap of 1464 circRNAs between the two experimental groups. (B) Genomic origin of circRNAs obtained from alignment to the mouse genome. (C) Circos visualization of the distribution of the identified circRNAs in mouse chromosomes. The outermost layer represents all mouse chromosomes, and each of the 3 inner layer show the circRNA distribution of every sample in the same group, while the red represents the expression levels of the circRNAs. (D) Heatmap of circRNA expression determined in the left ventricles of mice with or without isoproterenol treatment, as determined by next-generation sequencing (NGS). (E) Volcano plot showing altered circRNA expression upon isoproterenol treatment. A 2-fold change and P<0.05 were considered significant, and significantly upregulated and downregulated circRNAs are represented by red and green dots, respectively.