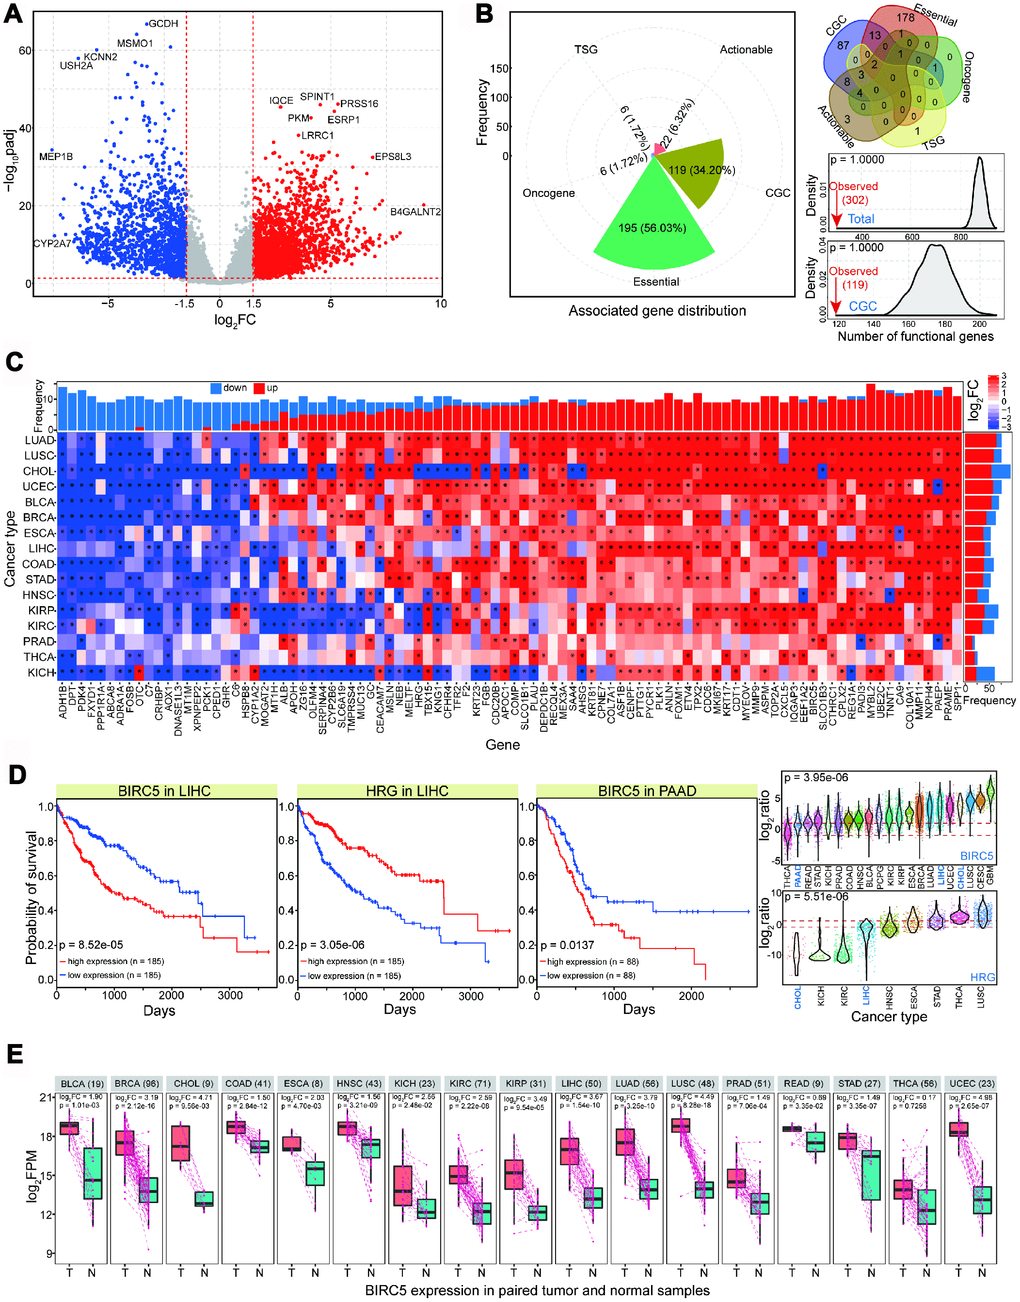
Figure 1.Abnormally expressed genes in CCA (named CHOL in TCGA) and their expression patterns across diverse cancer types. (A) Gene expression profiles in CHOL. Red point shows up-regulated gene (log2FC > 1.5 and padj < 0.05), blue point shows down-regulated gene (log2FC < -1.5 and padj < 0.05), and grey point shows normally expressed gene. Some abnormally expressed genes are presented their names. Red dotted lines show thresholds of log2FC (1.5 and -1.5) and padj (0.05). The baseMean values in DeSeq of these involved genes are not less than 50. (B) For screened abnormal genes, distributions of associated functional genes (mainly including essential gene, CGC, oncogene, etc) are presented. Compared with random result in the equal number of normally expressed genes, fewer abnormal genes are identified as functional genes. (C) Pan-cancer analysis of expression distributions of 94 screened dominant abnormal genes in CHOL (baseMean value > 500, log2FC > 2 or < -2, padj < 0.05), and all of these genes are abnormally expressed (log2FC > 2 or < -2, padj < 0.05) at least in 9 cancer types. (D) Examples of survival analysis of BIRC5 and HRG in LIHC and PAAD, and their expression distributions across different cancer types. (E) BIRC5 expression in paired tumor and normal samples, and the log2FC value and p value are also presented based on paired t-test. T indicates tumor samples, and N indicates paired normal samples. The total sample size is presented after cancer name.