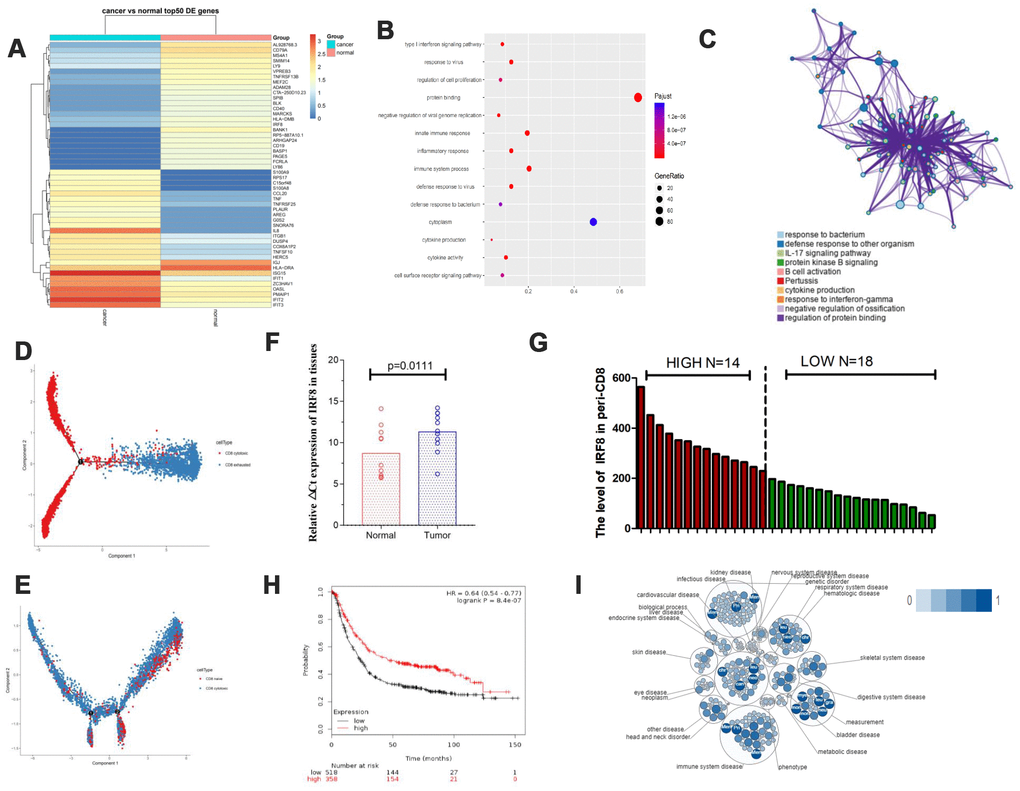
Figure 2.The transcription factor IRF8 was associated with CD8+ T cells in GC. (A) Heat map displaying the top 50 genes differentially expressed in CD8+ exhausted T cells from tissues. (B and C) Pathway analysis for CD8+ exhausted T cells. (D) Trajectory analysis for CD8+ T cells in tissues. (E). Trajectory analysis for CD8+ T cells in blood. (F) Expression of IRF8 in CD8+TILs from GC tissues and normal tissues. (G) Expression of IRF8 in peripheral blood CD8+ T cells from GC patients. (H) TGCA analysis of IRF8 in GC prognosis. (I). Pathway and disease analysis of IRF8.