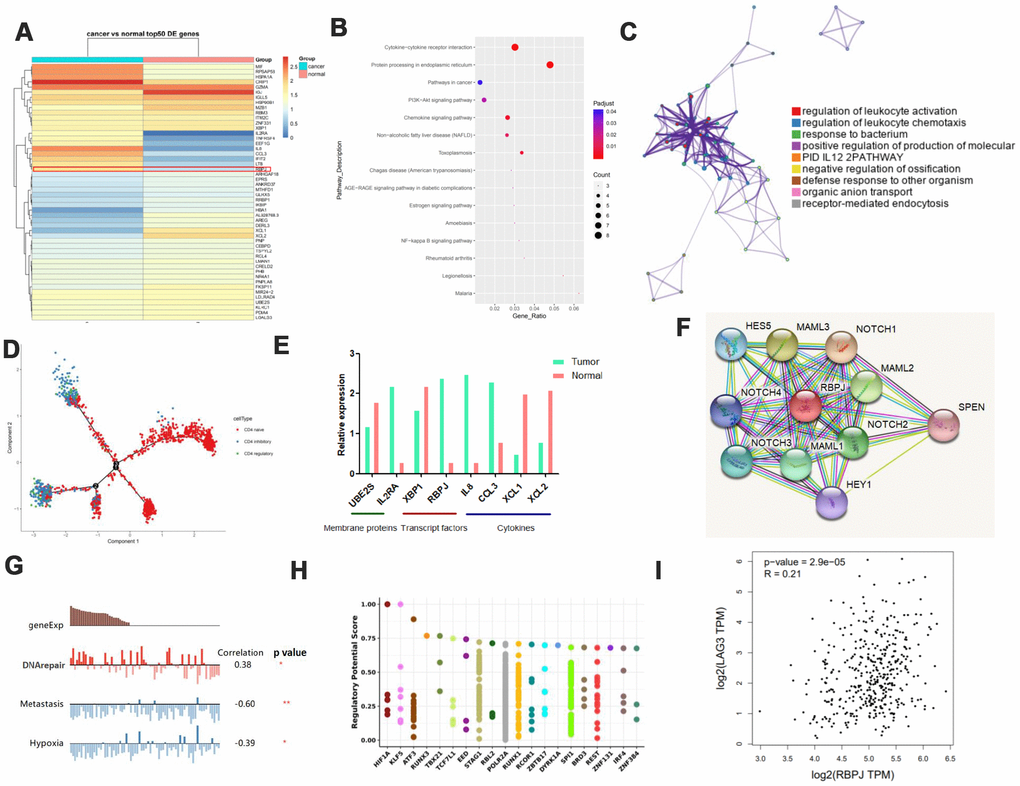
Figure 3.Identification of genes uniquely associated with Treg function in GC. (A) Heat map displaying the top 50 genes differentially expressed in Tregs from tissues. (B and C) Pathway analysis for different genes in Tregs. (D) Trajectory analysis for Tregs in tissues. (E) Expression of various molecules in Tregs. (F) STRING analysis of RBPJ. (G) Single-cell analysis using CancerSEA. (H) Top 20 differentially expressed TFs in cancers as shown by Cistrome DB Toolkit for RBPJ. (I) GEPIA analyses showing the association between RBPJ and LAG3.