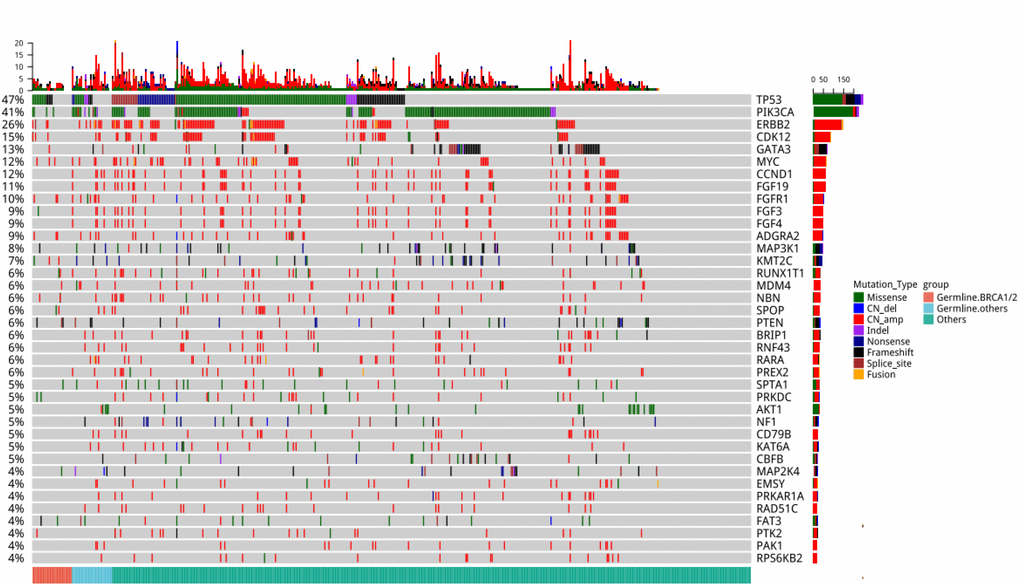
Figure 3.Comprehensive somatic mutation spectrum of the 524 patients. Each column represents a patient and each row represents a gene. The number on the left represents the percentage of patients with mutations in a specific gene. The top plot represents the overall number of mutations detected in a patient. Different colors denote different types of mutation. The annotation at the bottom, with each color representing each group, depicts the germline mutations carried by the patients.