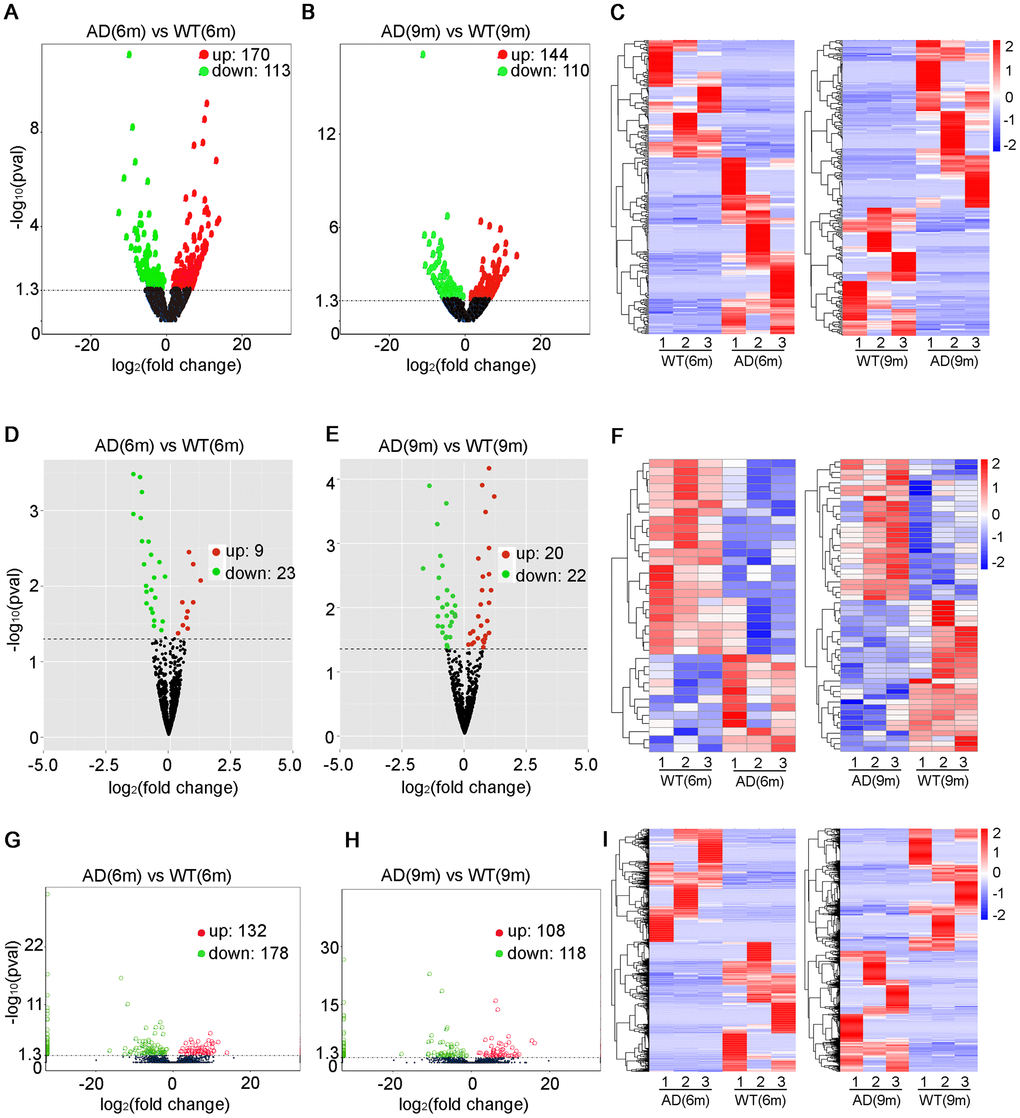
Figure 2.Expression profiles of distinct RNAs. (A–C) Expression profiles of lncRNAs. (A, B) In the volcano plots, green, red, and black points represent lncRNAs that were downregulated, upregulated, and not significantly different in APP/PS1 mice relative to wild-type (WT) control mice at 6 and 9 months, respectively. x-axis: log2 ratio of lncRNA expression levels between AD and WT. y-axis: false-discovery rate values (-log10 transformed) of lncRNAs, P<0.05 (C) Cluster analysis of expression of lncRNAs. Red and blue: increased and decreased expression at 6 and 9 months, respectively. Expression profiles are similarly shown for (D–F) miRNAs, p<0.04 and (G–I) mRNAs, q<0.05.