Submit an Article
Navigate
Home
Editorial Board
Editorial Policies
Current Volume
Archive
Scientific Integrity
Publication Ethics Statements
Interviews with Outstanding Authors
Newsroom
Sponsored Conferences
Podcast
Contact
Special Collections
Submit an Article
Online ISSN: 1945-4589
Research Paper
|
Volume 12, Issue 3
|
pp. 2952–2973
Tfh cell subset biomarkers and inflammatory markers are associated with frailty status and frailty subtypes in the community-dwelling older population: a cross-sectional study
Back to article
Figure 6
(6 of 6)
−
100%
+
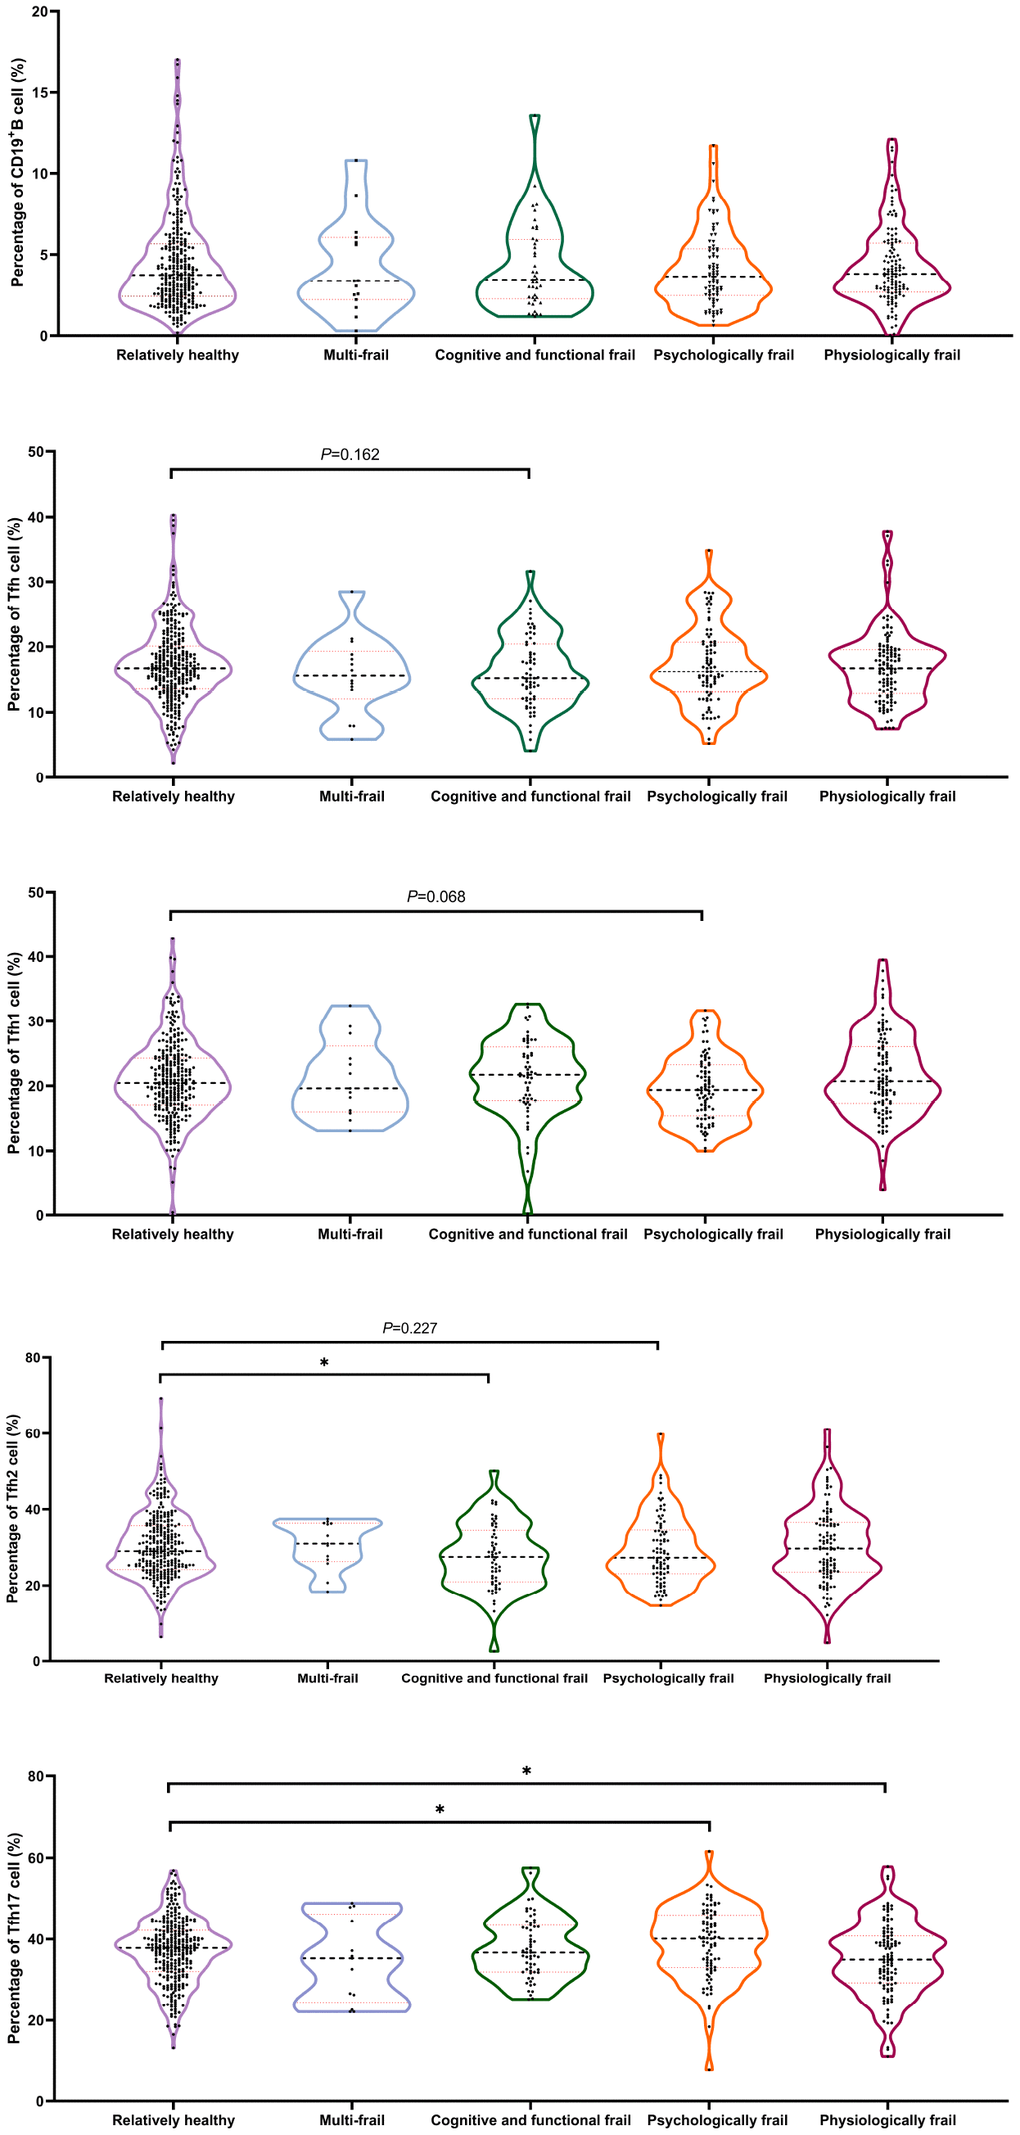
Figure 6.
Comparison of the Tfh cell and subsets proportions in the CD4
+
T cell in old individuals categorized with frailty subtypes.
(N=728) “Relatively healthy” as reference; *
P
< 0.05.