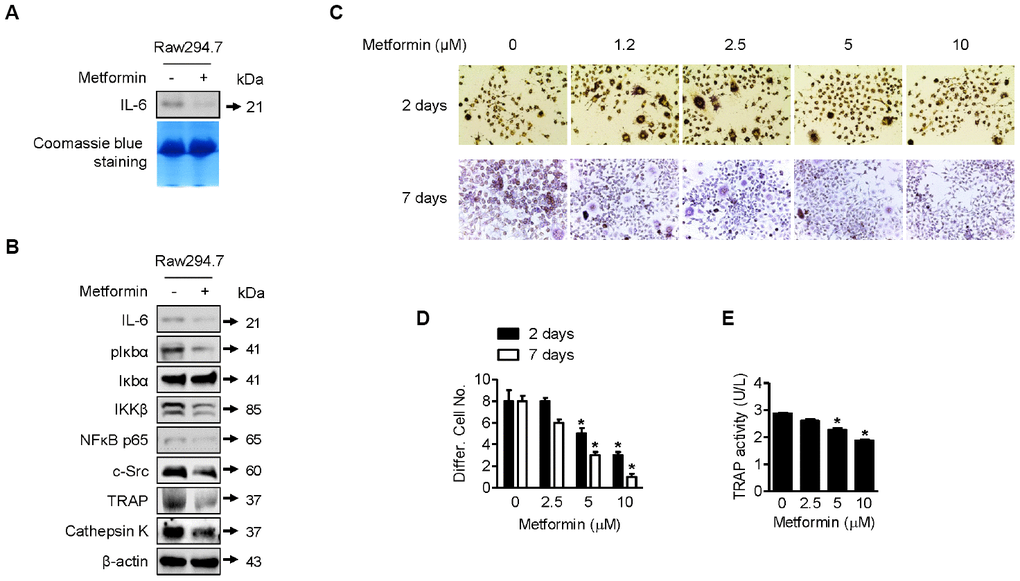
Figure 4.Downregulation of osteoclast differentiation by metformin. (A) For Western blotting analysis of IL-6 expression by metformin in RAW264.7 cells, cells were treated with 5 μM of metformin or an equal volume of DMSO (0.1%) for 1 h. Cell culture medium from the treated cells was condensed with a Microcon for Western blotting. Coomassie blue staining of SDS-PAGE gels were used for a loading control. (B) For Western blotting analysis, cells were treated with 5 μM of metformin or an equal volume of DMSO (0.1%) for 1 h. Cells were harvested, and the lysed proteins were resolved on SDS-PAGE and immunoblotted with specific antibodies against IL-6, pIκbα, Iκbα, IKKβ, NFκB p65, c-Src, TRAP, and Cathepsin K. β-actin blotting was used as a loading control. (C) Cells were treated with 2.5, 5, and 10 μM of metformin or an equal volume of DMSO (0.1%) with or without RANKL (0.1 μg/ml) for 2 or 7 days. During incubation, cell culture medium containing the proper amount of metformin was changed every other day. Cells were fixed and stained by the TRAP staining kit according to the manufacturer’s manual. For quantitative comparison, multinucleated cells were counted (D). (E) RAW264.7 cells were treated with 2.5, 5, and 10 μM of metformin or an equal volume of DMSO (0.1%) for 1 h. TRAP activity in cells was analyzed according to the manufacturer’s protocol. Significant differences between metformin and DMSO control groups are indicated (*P < 0.05, a paired t-test). Experiments were performed in triplicate, and the error bars represent standard deviation.