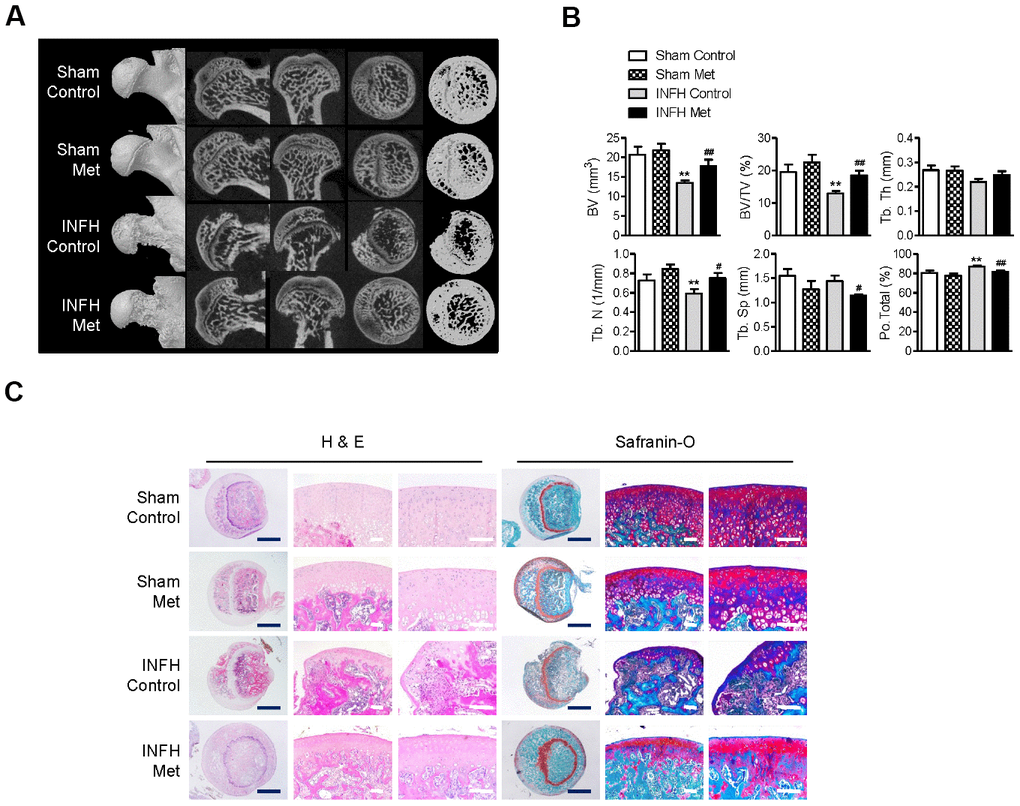
Figure 5.Protective effect of metformin in the INFH rat model. (A) Representative images of μCT in sham-operated rats with saline injection (Sham Control), sham-operated rats with metformin injection (Sham Met), INFH-operated rats with saline injection (INFH Control), and INFH-operated rats with metformin injection (INFH Met). Images are arranged in order of 3D μCT reconstructions of femoral head area and the coronal, sagittal, and middle areas of femoral heads. (B) Morphometric indices in femoral heads of the four groups. Values are presented as the mean ± STD (n = 5). **p < 0.001 versus Sham Control, #p < 0.01 and ##p < 0.001 versus INFH Control. (C) Representative images of H & E and Safranin-O staining in the four groups. Black bars = 500 μm, white bars = 50 μm. Abbreviations: BV, bone volume; Tb. N, trabecular number; Tb.Sp, trabecular separation; Tb.Th, trabecular thickness; TV, tissue volume; Po, porosity.