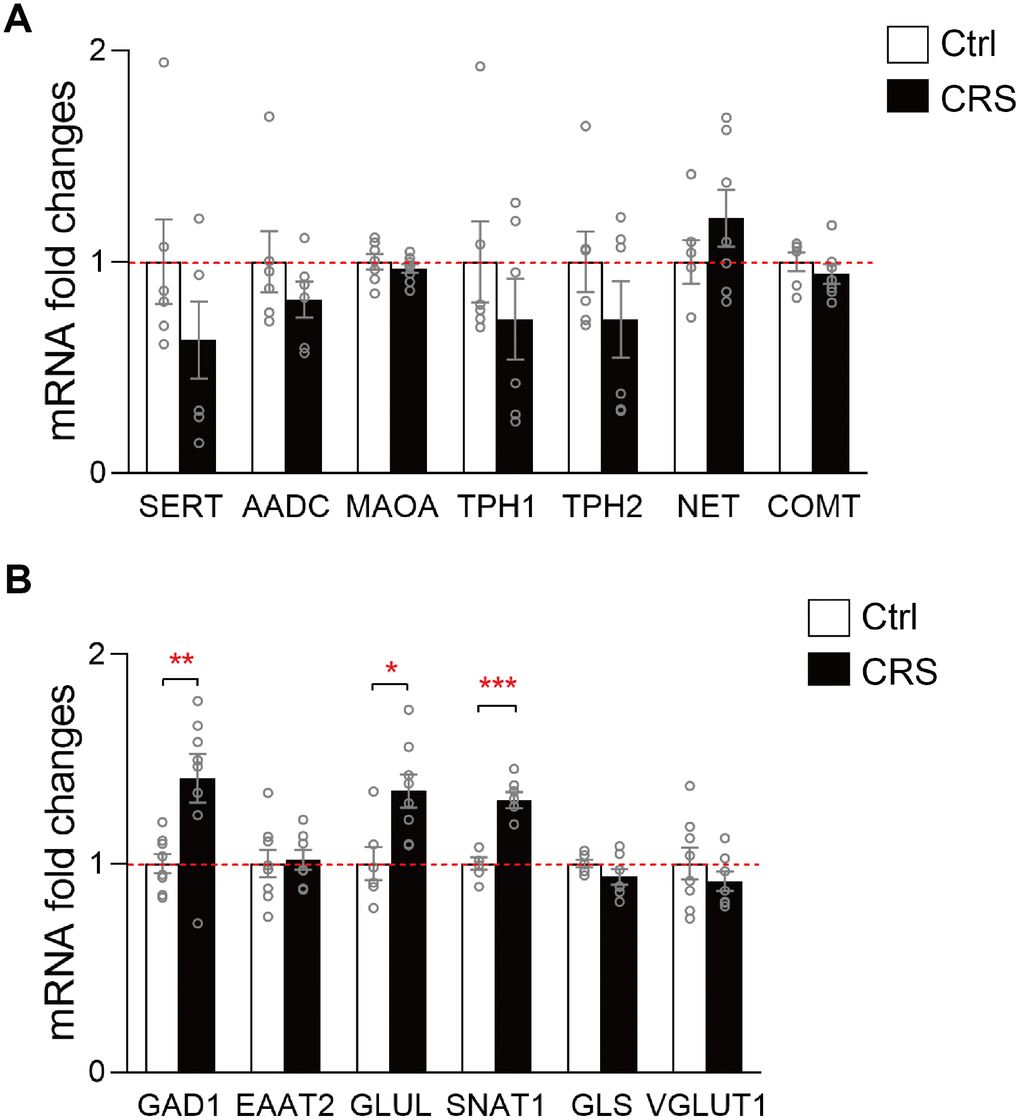
Figure 3.RT-qPCR validation of mRNA expression levels of key enzymes and transporters in glutamatergic and monoaminergic pathways in the EC of mice after CRS exposure. β-actin and GAPDH were used to normalize the expression levels of genes in control group and CRS group. (A) The mRNA expression levels of SERT, AADC, MAOA, TPH1, TPH2, NET and COMT in monoaminergic pathway were examined by RT-qPCR. (B) The mRNA expression levels of GAD1, EAAT2, GLUL, SNAT1, GLS and VGLUT1 in glutamatergic pathway were tested in both groups through RT-qPCR. (* P<0.05, ** P<0.01, *** P<0.001; n=6-8 mice per group).