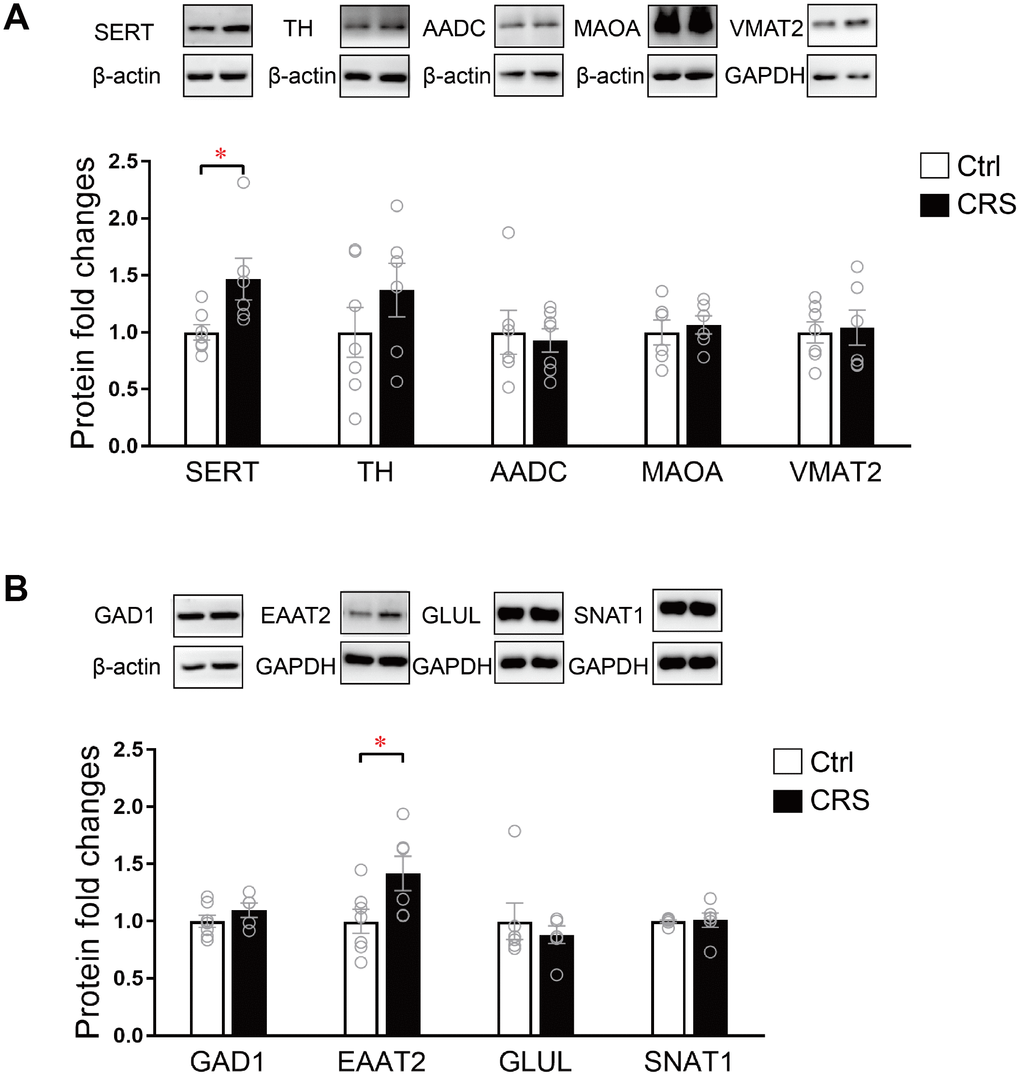
Figure 4.Western blot analysis of protein expression levels of key enzymes and transporters in glutamatergic and monoaminergic pathways in the EC of mice after CRS exposure. β-actin and GAPDH were used to normalize the expression levels of proteins in control group and CRS group. (A) The protein expression levels of SERT, TH, AADC, MAOA and VMAT2 in monoaminergic pathway were examined by western blott (* P<0.05, n=6-7 mice per group). (B) The protein expression levels of GAD1, EAATT2, GLUL and SNAT1 in glutamatergic pathway were analyzed in both groups. (* P<0.05; n=6-7 mice per group).