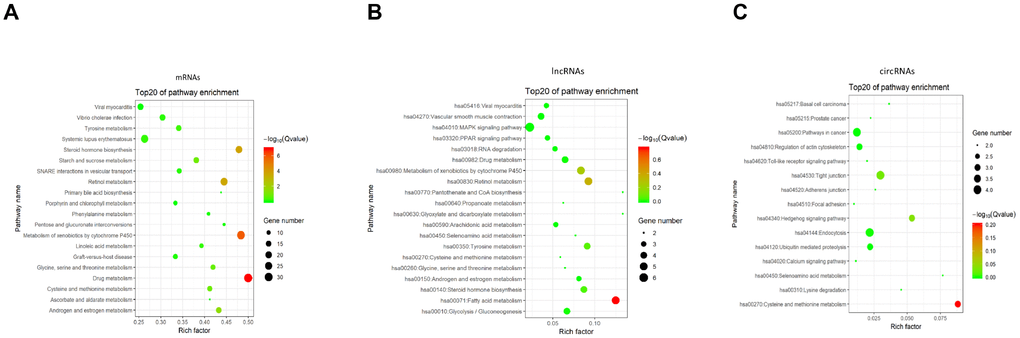
Figure 9.KEGG pathway enrichment of differentially expressed mRNAs (A), lncRNAs (B) and circRNAs (C). Enriched KEGG pathway scatter plot showing statistics of pathway enrichment in between the BCSCs and BCNSCs. The vertical axis represents the pathway name and the horizontal axis represents the rich factor. The size of the dot represents the number of differentially expressed genes in the pathway and the color of the point corresponds to the different q-value range.