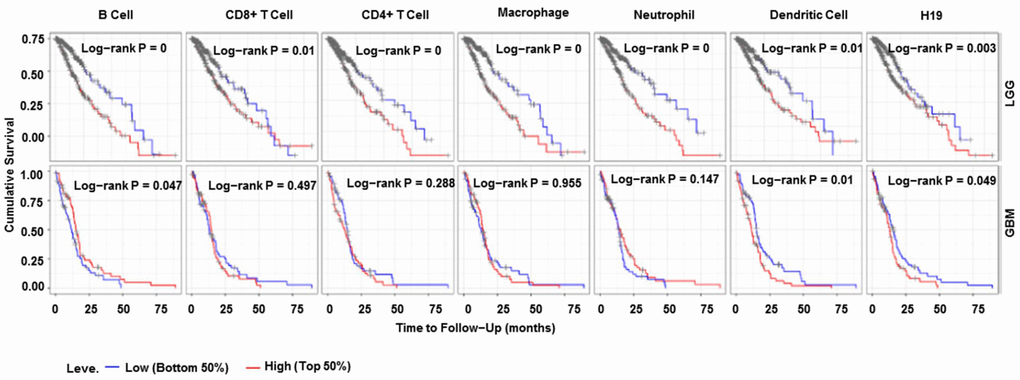
Figure 15.Immune cell infiltration survival curve. They are K-M survival curves based on top and bottom sample partitions with 50% and 50% immune penetration, respectively. Red means high degree of infiltration and blue means low degree of infiltration. P< 0.05 was considered significant, and P < 0.0001 was represented by 0. Abbreviations: K-M, Kaplan-Meier plotter.