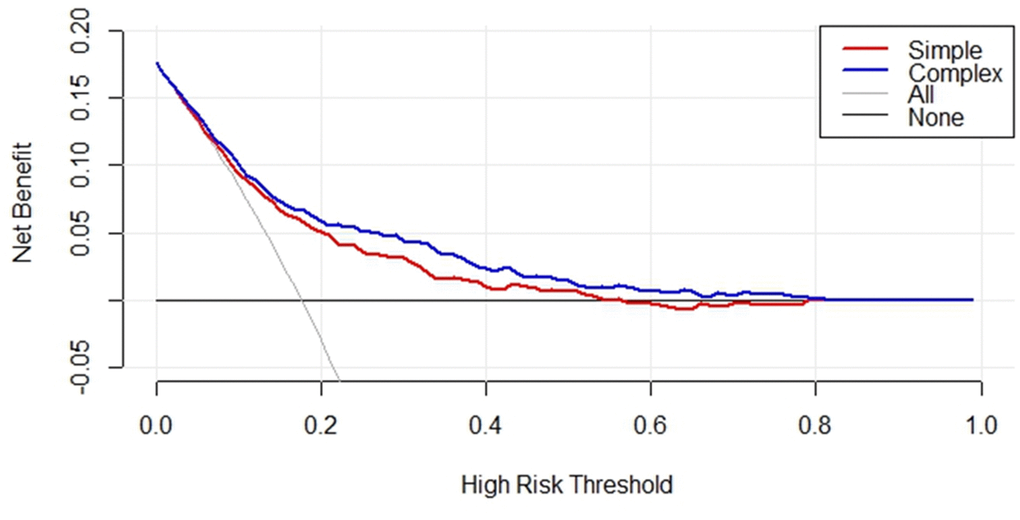
Figure 5.Decision curve analysis for serum lipids, inflammatory markers, and serological status in RA and CHD patients of the simple and complex model in the training cohorts. The y-axis represents the net benefit, the x-axis represents the high-risk threshold of CHD in RA patients. The red line represents the nomogram of predictors in simple model. The blue line represents the complex model with addition of sex and age. The gray line represents the assumption that all patients have CHD.