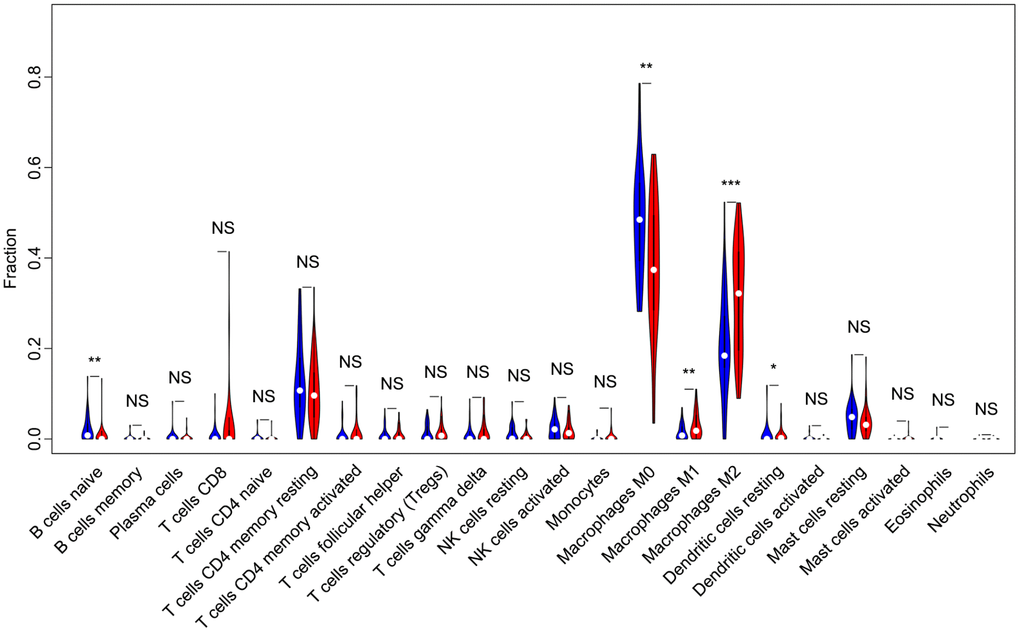
Figure 2.Violin plot comparing the proportions of TIICs between low and high immune score OS samples. Horizontal and vertical axes respectively represent TIICs and relative percentages. Blue and red colors represent low and high immune score OS samples, respectively. Data were assessed by the Wilcoxon rank-sum test. *P<0.05, **P<0.01, ***P<0.001. NS, no significance; TIICs, tumor-infiltrating immune cells; OS, osteosarcoma; NK, natural killer.