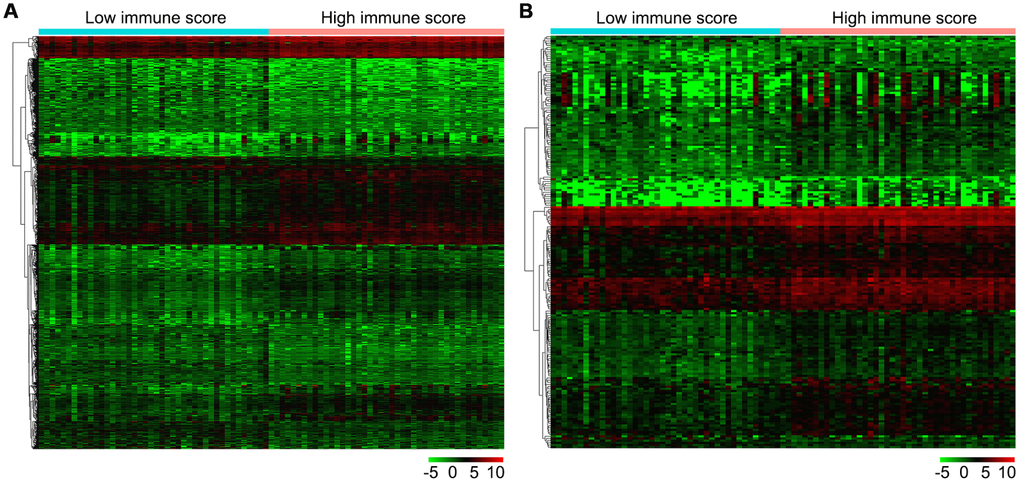
Figure 4.Gene expression profiles in high and low immune score OS samples. (A) Heat map of DEGs based on immune score in OS samples. (B) Heat map of immune-related DEGs based on immune score in OS samples. Horizontal and vertical axes represent OS samples and genes, respectively. Genes with higher, lower, and same expression levels are shown in red, green, and black, respectively. Color bars on top of the heat map represent sample types, with blue and pink indicating low and high immune score samples, respectively. DEGs, differentially expressed genes; OS, osteosarcoma.