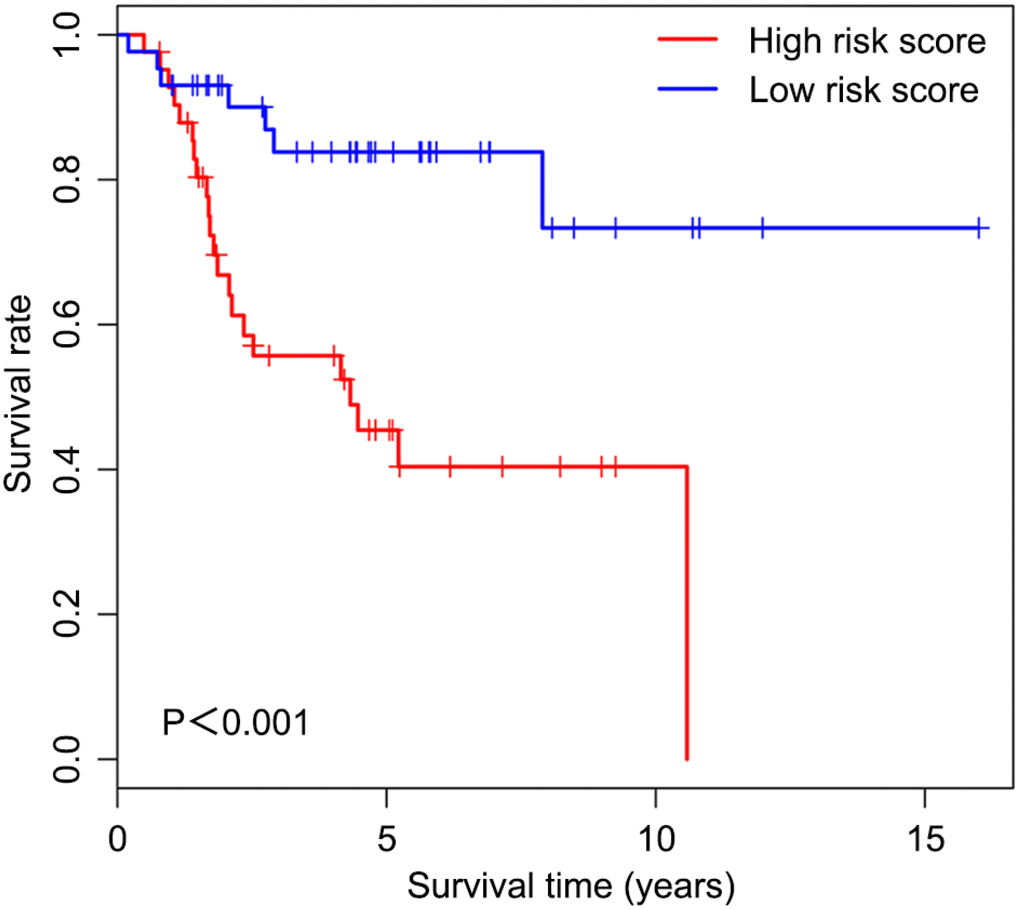
Figure 6.Overall survival curves obtained by the Kaplan-Meier method indicate that the risk score is significantly associated with OS prognosis. Horizontal and vertical axes represent survival times and rates, respectively. Red and blue curves are samples with risk score higher and lower than the median value, respectively. Plus signs indicate censored values. Depicted P-values were obtained by the logrank test. OS, osteosarcoma.