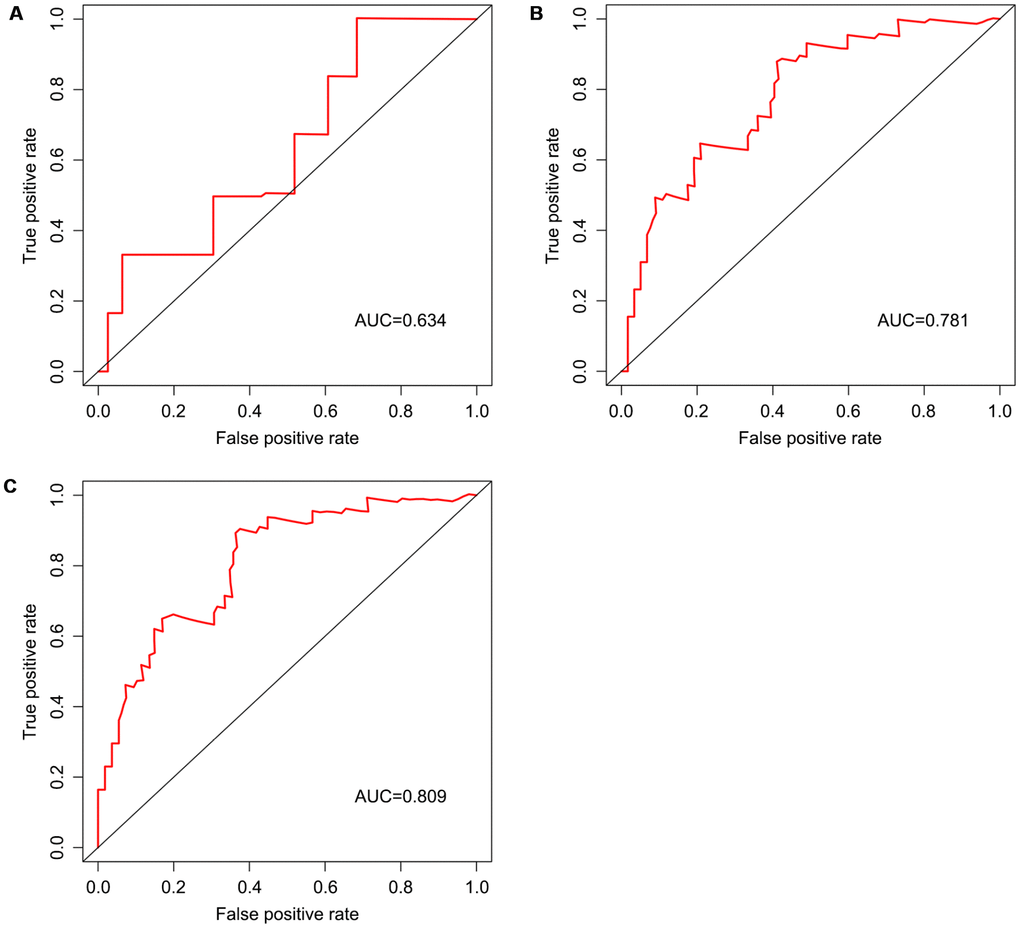
Figure 7.Survival prediction based on the risk score, determined by time-dependent ROC curve. Horizontal and vertical axes are false positive and true positive rates, respectively. The AUC values for the risk model in predicting the 1-year (A) 3-year (B) and 5-year (C) survival were 0.634, 0.781, and 0.809, respectively. ROC, receiver operating characteristic; AUC, area under the curve.