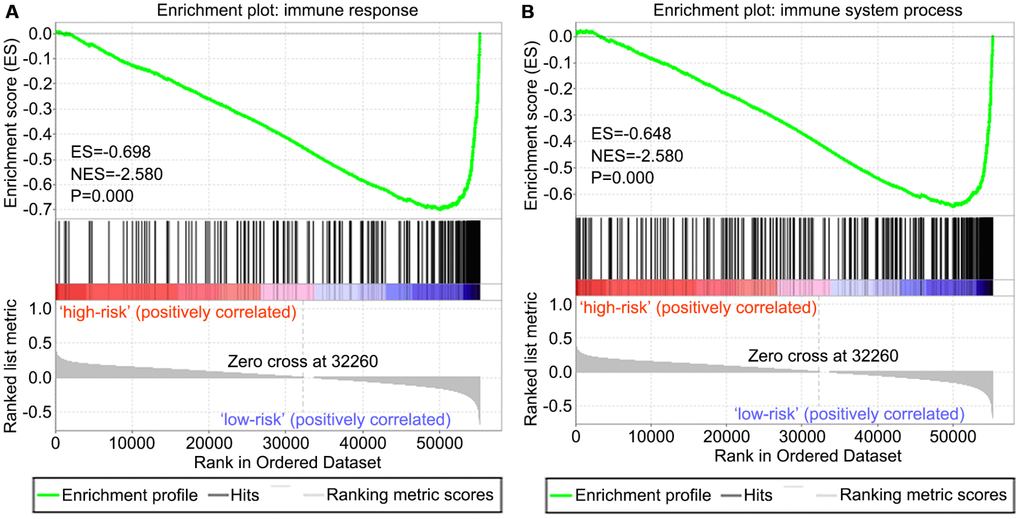
Figure 8.GSEA of the risk score in OS. Both immune response and immune system process gene sets were enriched in the low-risk group. The horizontal axis represents genes of the immune response (A) and immune system process (B) gene sets, ranked by decreasing risk score. The vertical axis represents enrichment score. The enrichment score increased with the number of enriched genes and vice versa. ES, enrichment score; NES, normalized enrichment score.