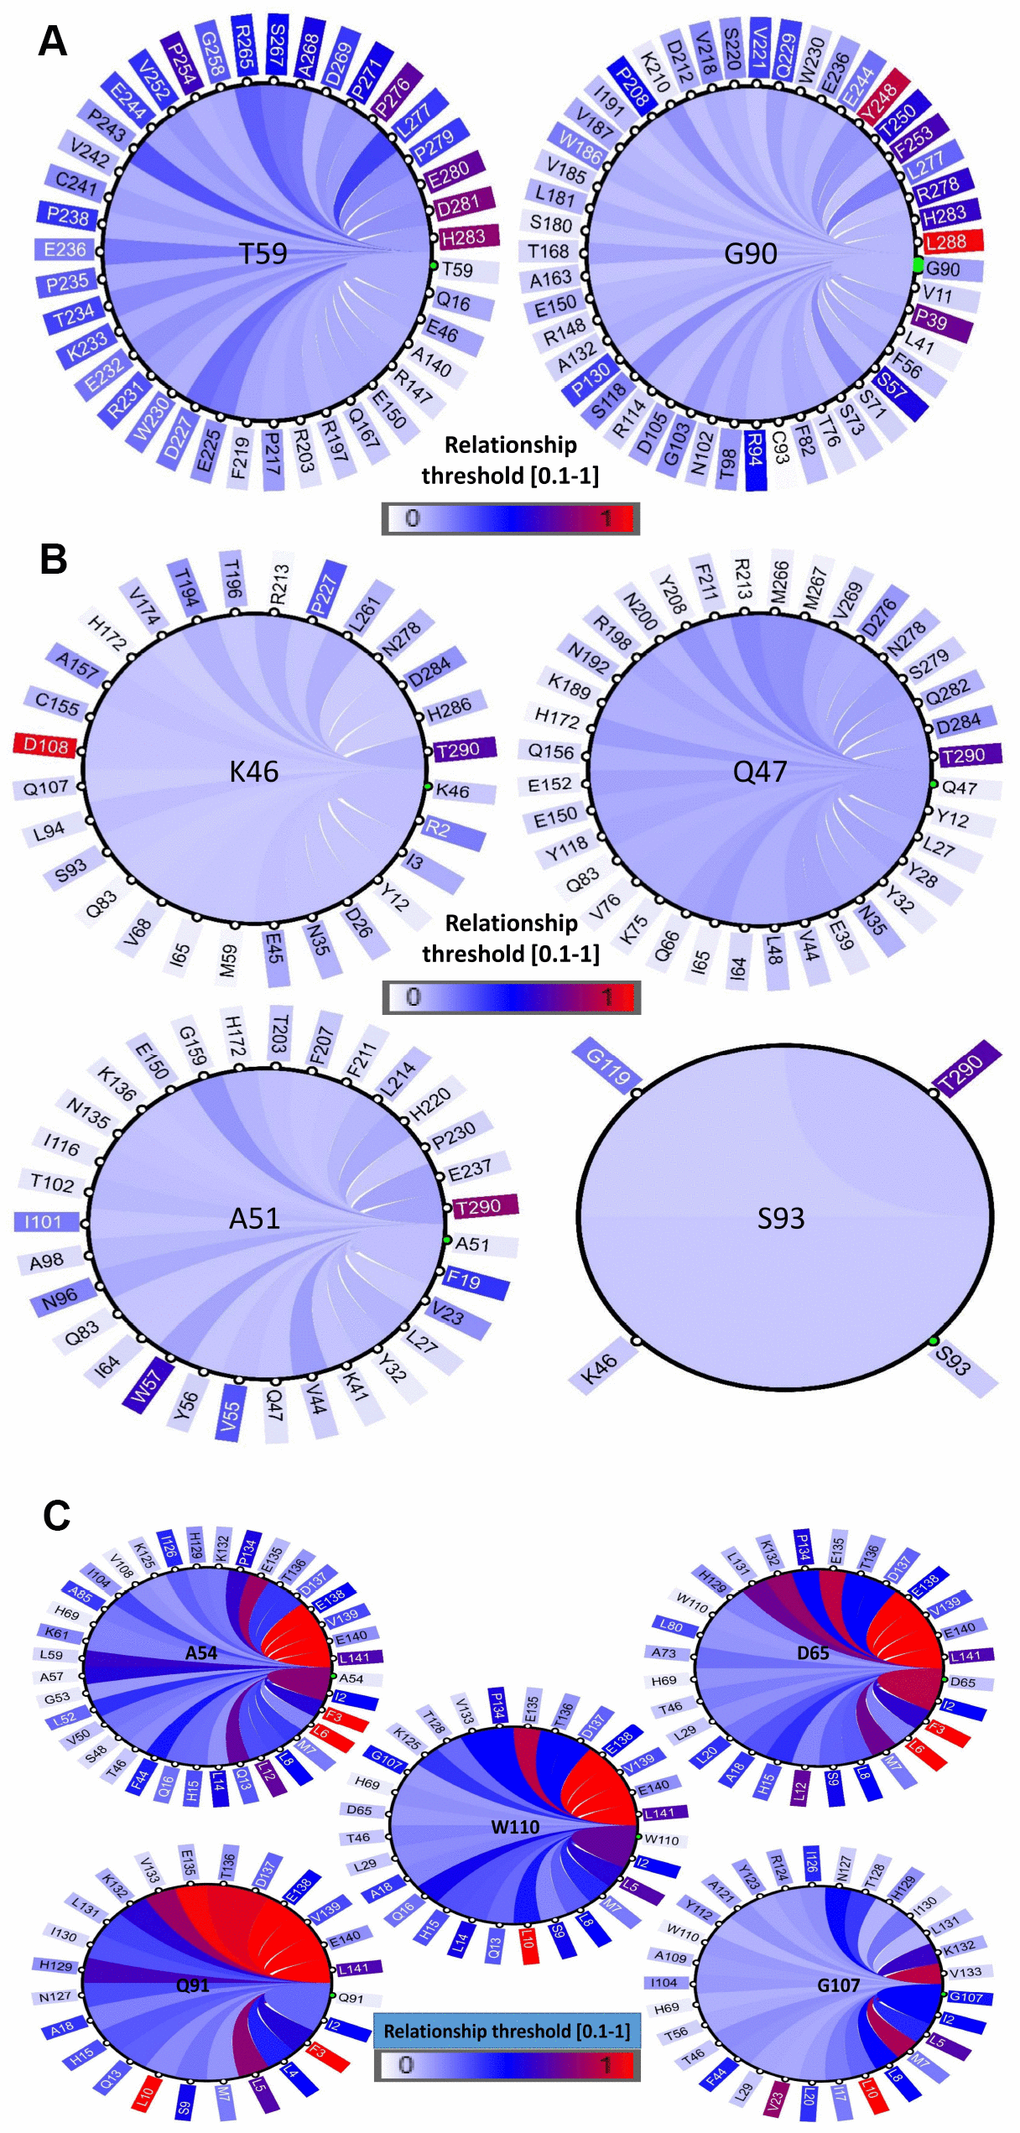
Figure 7.Coevolution analysis of positively selected conserved domain residues. The circular relation diagram centered on the residues with their top co-varying residues at cutoffs (A) PD1, (B) PD-L1 and (C) PD-L2. Labels on the diagram represent amino acid residues and their positions in the protein sequence. Colors of the arcs represent covariance scores between two given positions. Colors of the arcs represent covariance scores between two given positions.