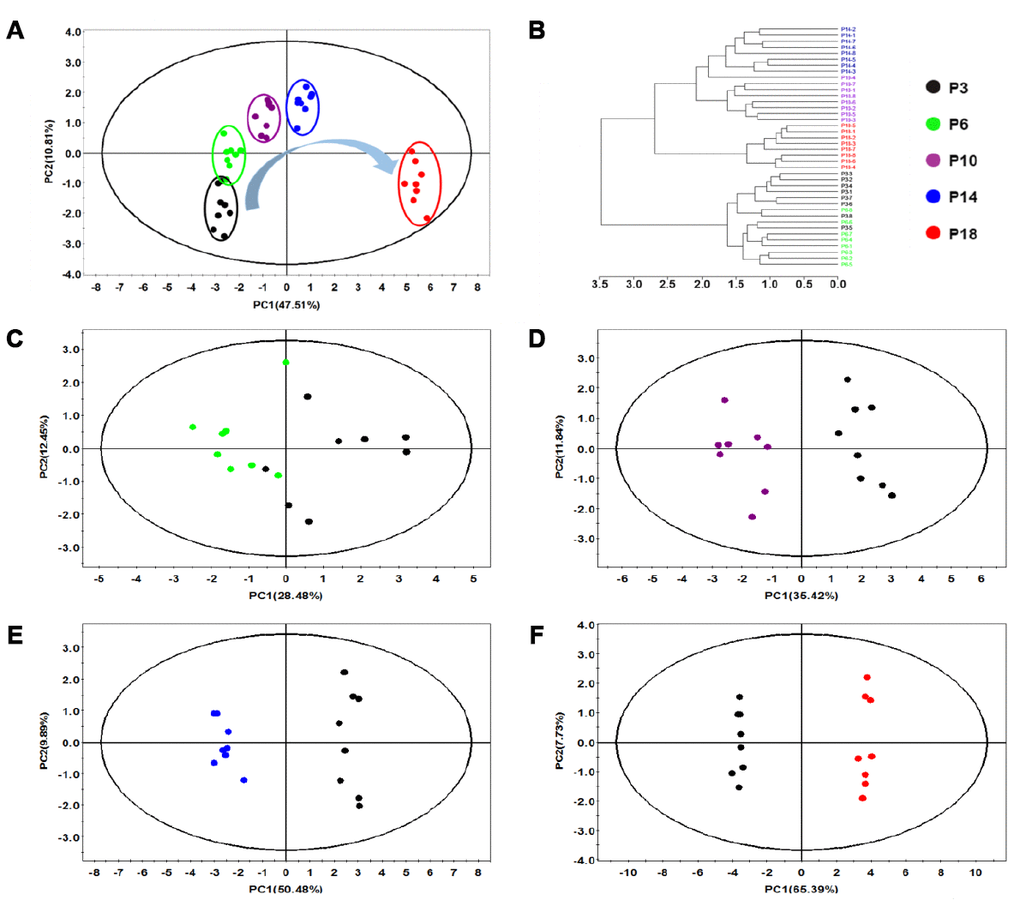
Figure 2.Multivariate analysis of changed metabolic profiles of HUVEC cells during continued passaging. (A) PCA scores plot of 1H NMR data obtained from the five groups of cells. (B) Hierarchical cluster analysis of the five groups of cells. (C–F) Pair-wise PCA scores plots of P6 cells vs. P3 cells (C), P10 cells vs. P3 cells (D), P14 cells vs. P3 cells (E), P18 cells vs. P3 cells (F).