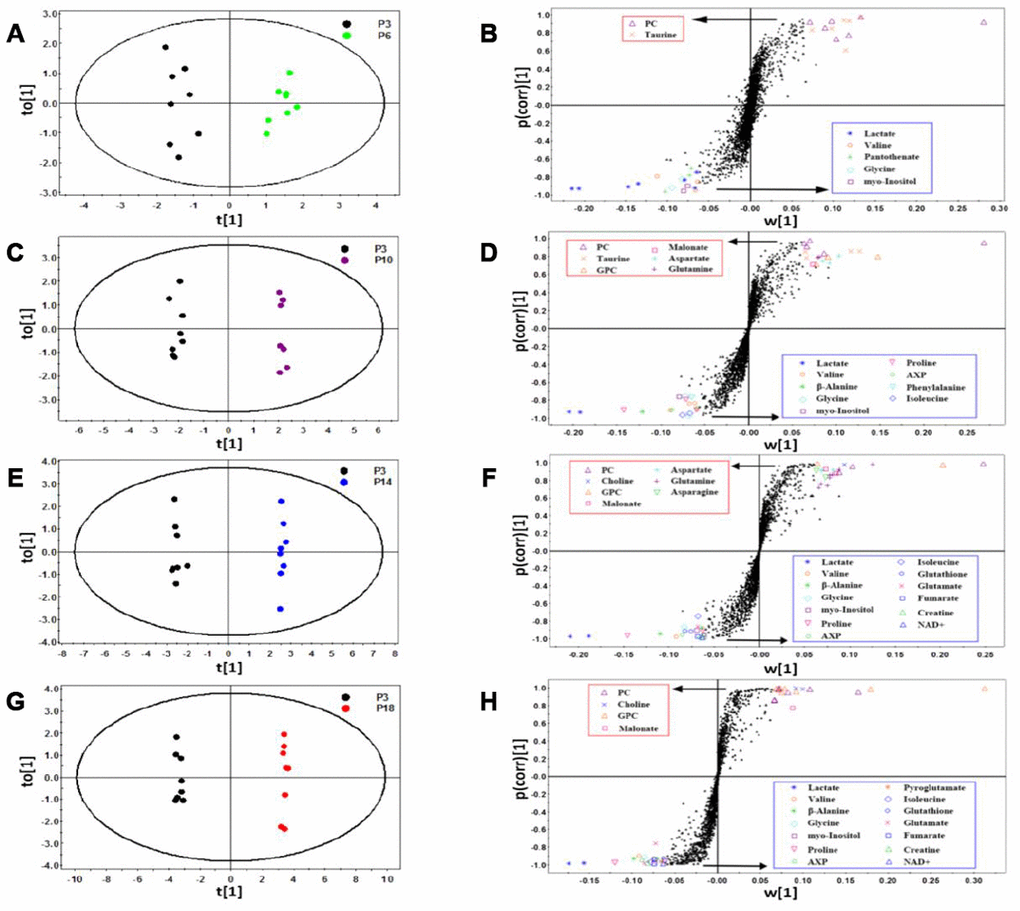
Figure 3.Identification of significant metabolites primarily responsible for distinguishing metabolic profiles of the four groups of HUVEC cells from the P3 group. (A–H) OPLS-DA scores plots and corresponding S-plots of P6 vs. P3 (A and B), P10 vs. P3 (C and D), P14 vs. P3 (E and F), P18 vs. P3 (G and H). Each point in the OPLS-DA scores plots represents a cell sample. Each dot in the S-plots denotes a bin. Bin points with |w [1] | > 0.06, |p(corr) [1] | > 0.75 and VIP ≥ 1.00, were identified to be significant metabolites. The identified metabolites showed in the red/blue rectangle represent significantly up-regulated/down-regulated metabolites in the four groups of cells relative to the P3 group.
Figure 3 — NMR-based metabonomic analysis of HUVEC cells during replicative senescence | Aging