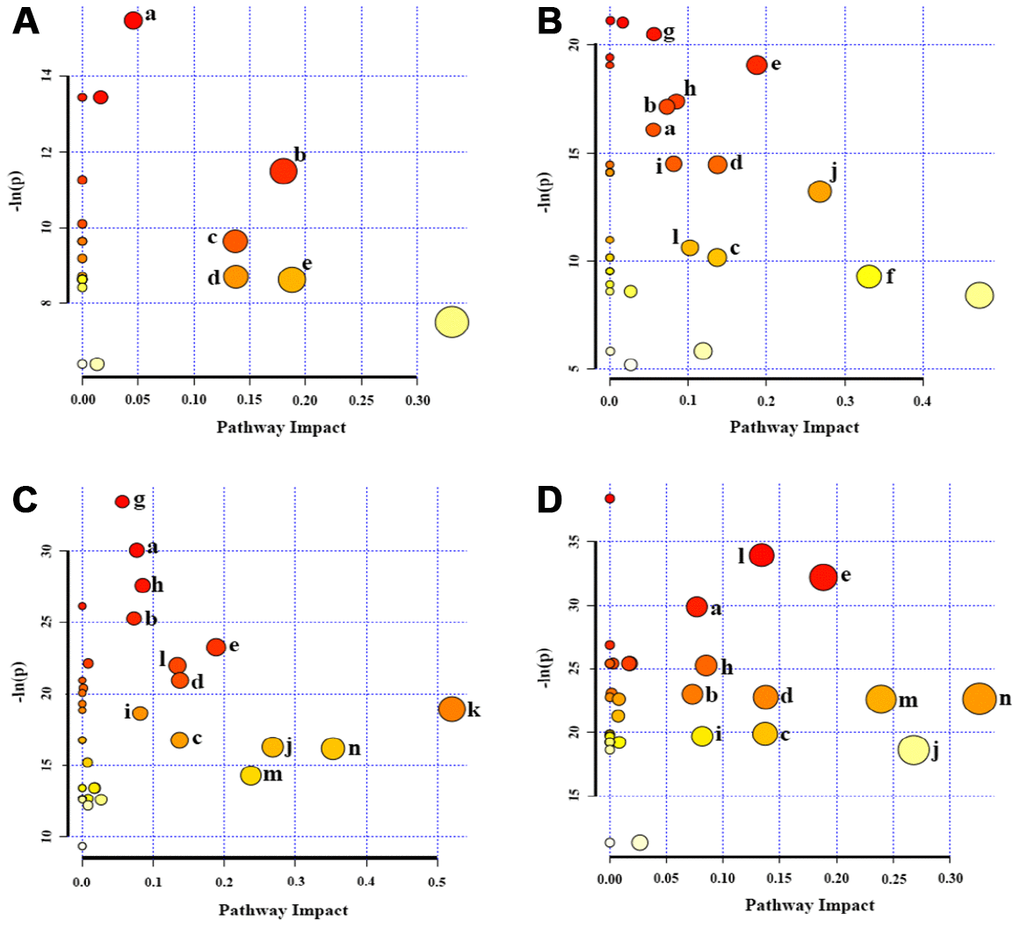
Figure 5.Significantly altered metabolic pathways in the four groups of HUVEC cells compared to the P3 group. (A) P6 vs. P3; (B) P10 vs. P3; (C) P14 vs. P3; (D) P18 vs. P3. A bubble represents an identified metabolic pathway. The bubble size is proportional to the pathway impact value (PIV), with the color denoting the statistical significance [-ln(p)] from highest (in red) to lowest (in white). Metabolic pathways with -ln(p) > 8 and PIV > 0.03 were identified to be significantly altered metabolic pathways, including: a, glycerophospholipid metabolism; b, pantothenate and CoA biosynthesis; c, inositol phosphate metabolism; d, pyruvate metabolism; e, glycine, serine and threonine metabolism; f, taurine and hypotaurine metabolism; g, aminoacyl-tRNA biosynthesis; h, propanoate metabolism; I, purine metabolism; j, β-Alanine metabolism; k, glanine, aspartate and glutamate metabolism; l, arginine and proline metabolism; m, glutathione metabolism; n, glutamate and glutamine metabolism.