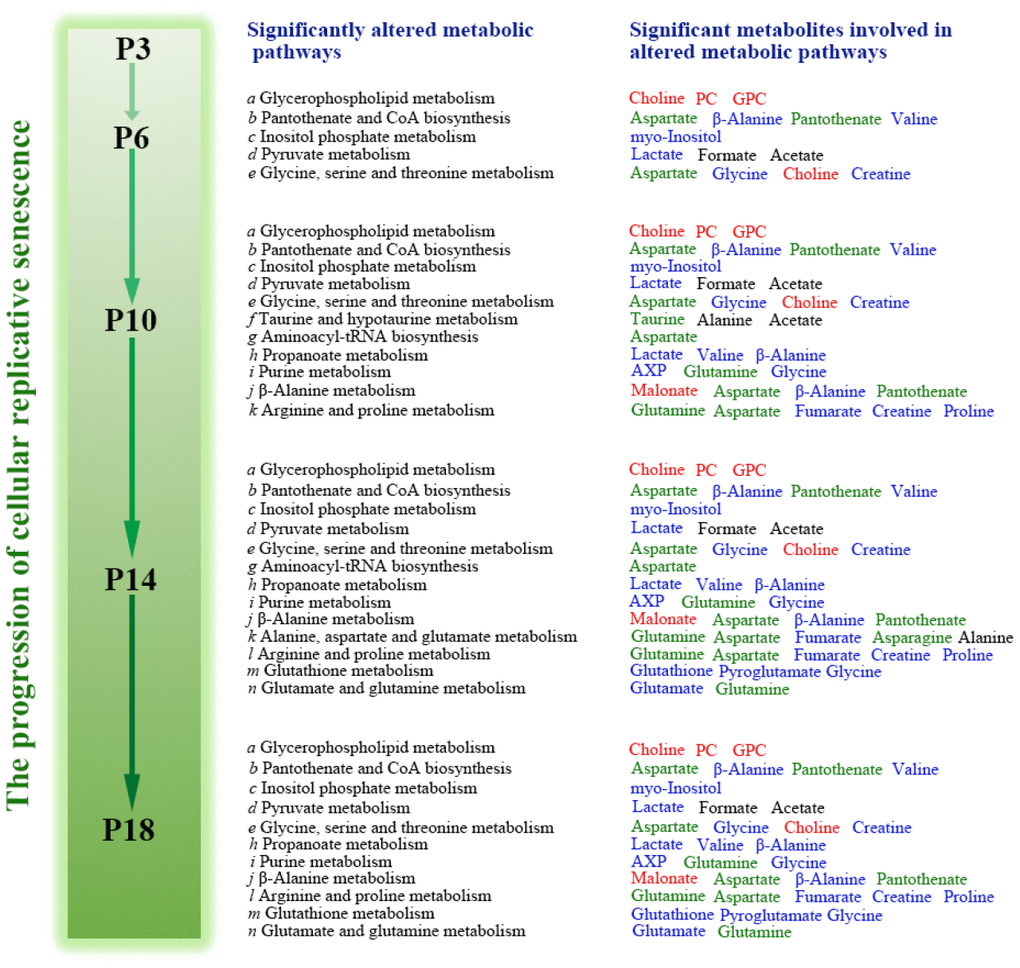
Figure 6.Schematic representation of significantly altered metabolic pathways associated with the four groups of HUVEC cells compared with the P3 group. Red, blue and black colors represent significantly increased, decreased and substantially unchanged metabolites during the progression of cellular replicative senescence relative to the early P3 passage. Green colors denote the metabolites with increasing tendencies followed by decreasing tendencies, or those with the contrary changing trends.