Submit an Article
Navigate
Home
Editorial Board
Editorial Policies
Current Volume
Archive
Scientific Integrity
Publication Ethics Statements
Interviews with Outstanding Authors
Newsroom
Sponsored Conferences
Podcast
Contact
Special Collections
Submit an Article
Online ISSN: 1945-4589
Research Paper
|
Volume 12, Issue 5
|
pp. 4124–4162
ESHRD: deconvolution of brain homogenate RNA expression data to identify cell-type-specific alterations in Alzheimer’s disease
Back to article
Figure 2
(2 of 3)
−
100%
+
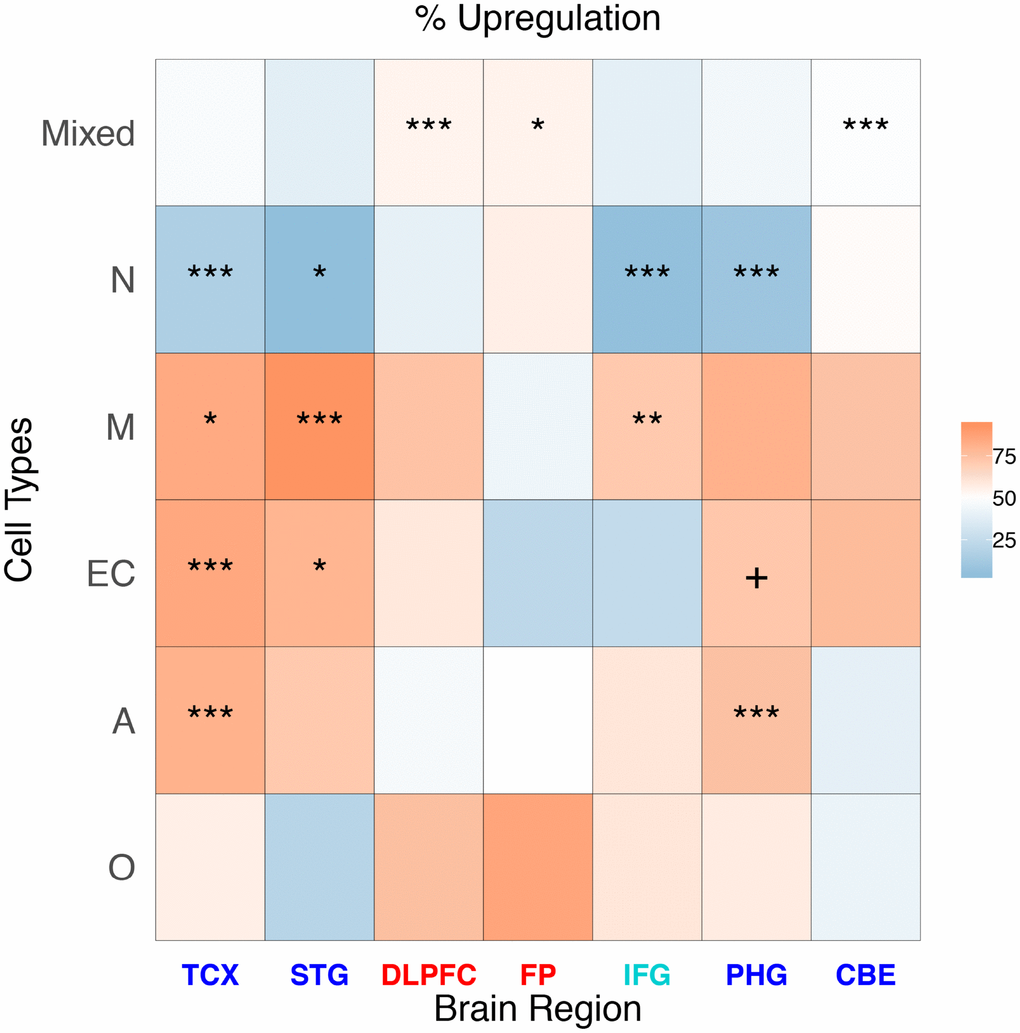
Figure 2.
Heatmap representing the proportion of up-regulated AD genes for cell type and brain region in cell-specific and “mixed” genes.
The stars represent a significant enrichment of a particular gene type among DEGs.