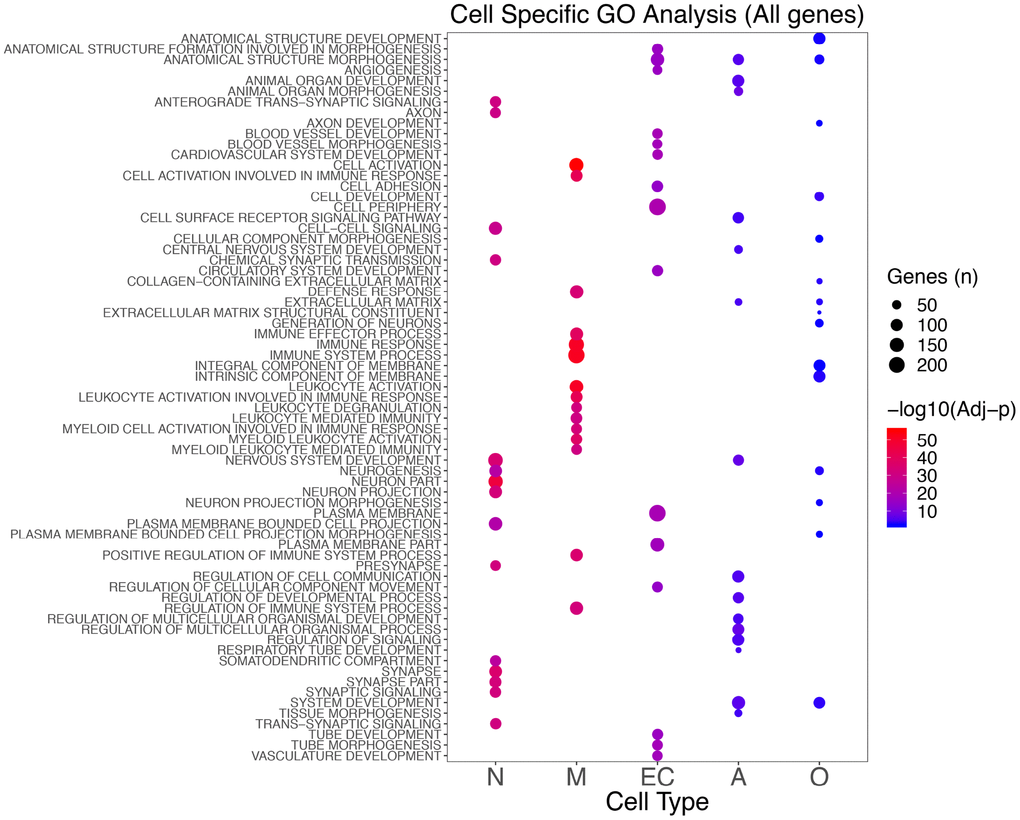
Figure 3.Top 15 significant GO classes identified in the different cell types combining the results for the seven brain regions analyzed. The color scale indicates the significance (blue to red as the significance increases), whereas the size shows the number of genes in that specific enriched class in AD.