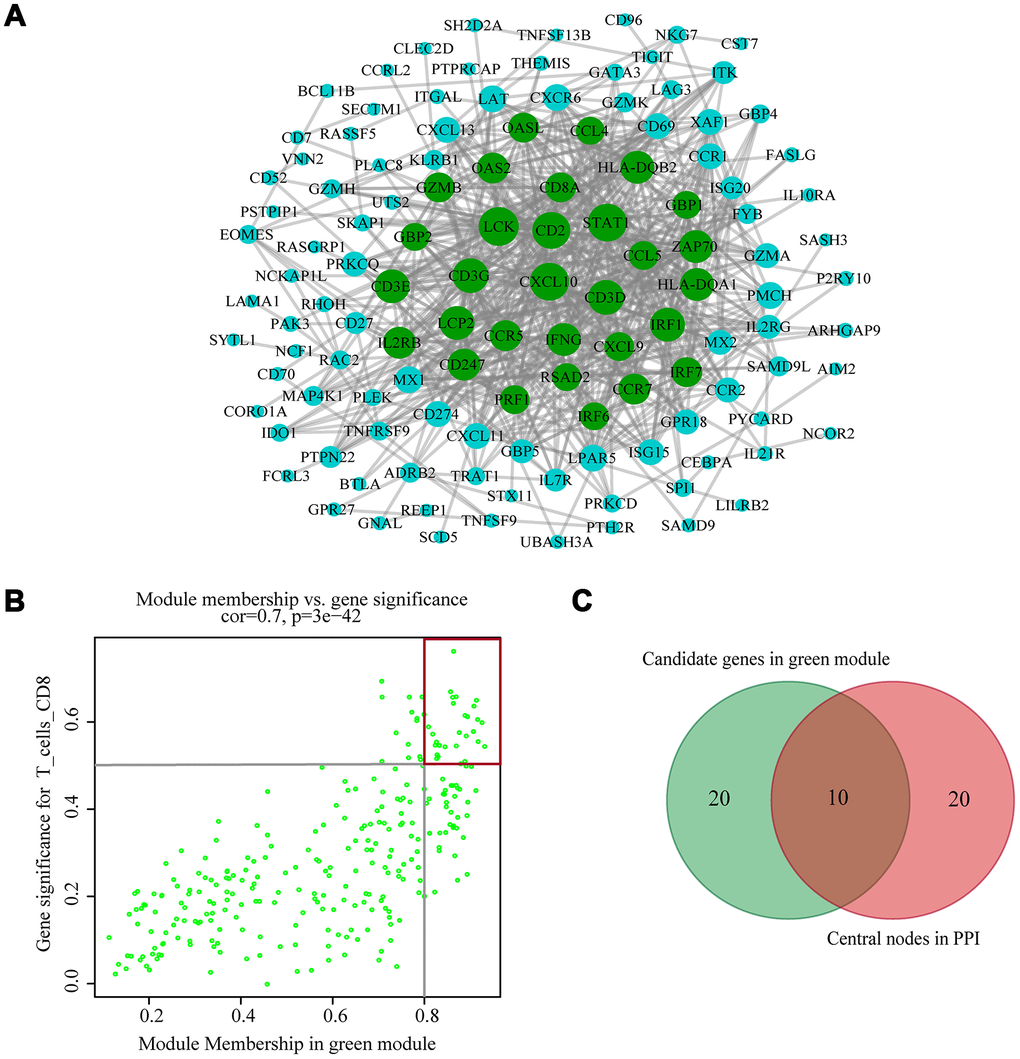
Figure 4.Identification of hub genes. (A) PPI network of genes from the green module. The higher the number of connected nodes, the larger the size of the node. The green nodes represent a central node with more than 15 connections. (B) A scatter plot of the genes in the green module. Each green dot represents a gene, and dots within the red box indicate genes of Module Membership > 0.8 and Gene Significance > 0.5. (C) Hub genes were selected based on overlap between PPI and co-expression networks.