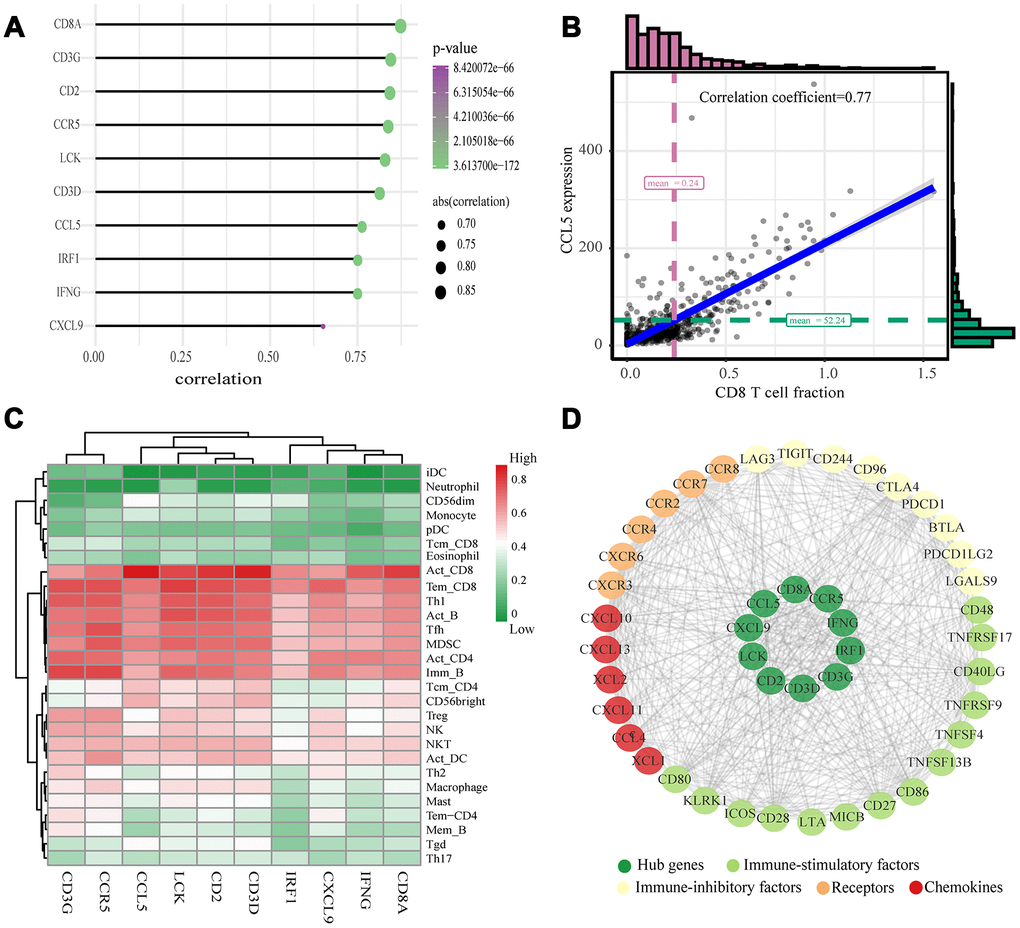
Figure 5.Validation of hub genes and PPI map construction. (A) Relationship between 10 hub genes expression and CD8+ T cell infiltration level; P < 0.05 is considered statistically significant. (B) Scatter plot of CCL5 expression and CD8+ T cell infiltration level. (C) The heat map shows the correlation between the ten identified hub genes and the TIICs from the TISIDB database. The redder color indicates a higher correlation, and greener color indicates a lower correlation. (D) Protein-protein interaction map of the ccRCC immune microenvironment.