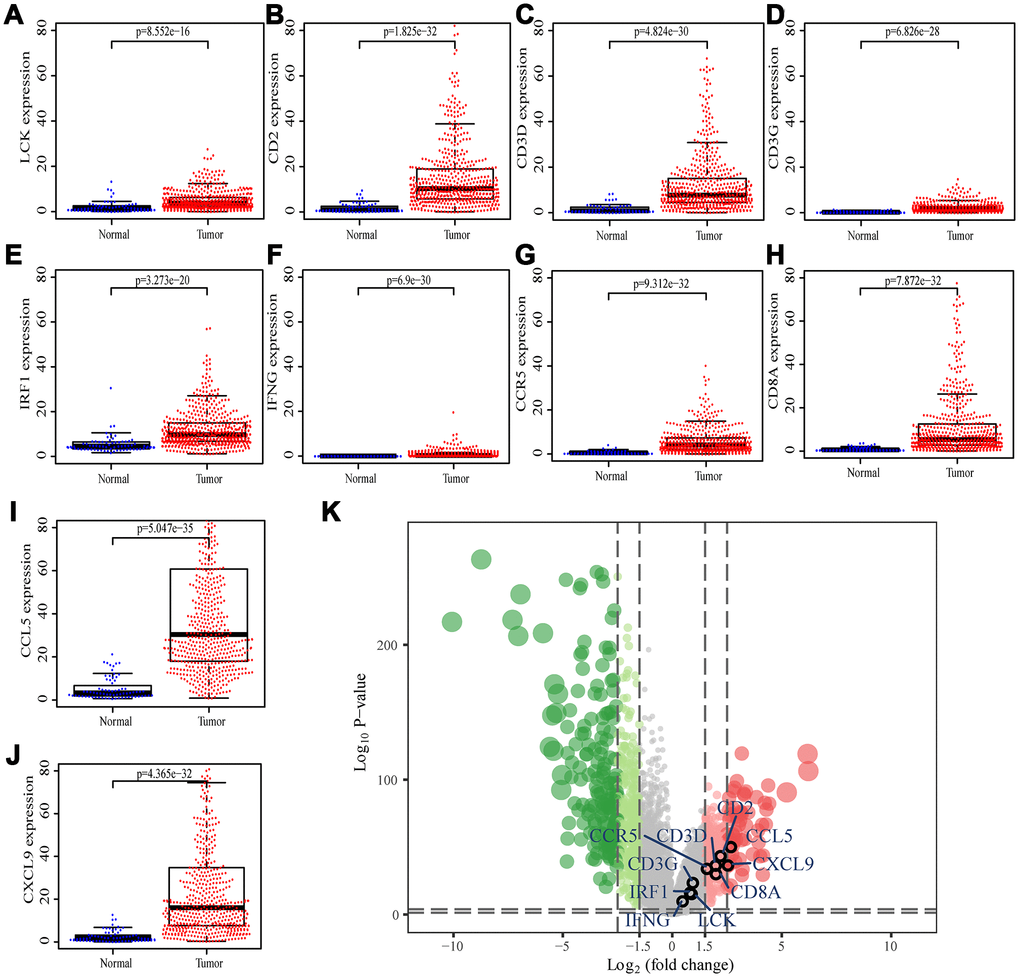
Figure 6.Differential expression of the hub genes in transcriptional data of TCGA. (A) LCK, blue dots represent normal tissue and red dots represent tumor tissue. The y-axis shows the expression value of the gene. (B) CD2. (C) CD3D. (D) CD3G. (E) IRF1. (F) IFNG. (G) CCR5. (H) CD8A. (I) CCL5. (J) CXCL9. (K) The volcano plot of differentially expressed genes. Red dots indicate overexpression genes, green dots indicate low expression genes, and black circles represent hub genes.