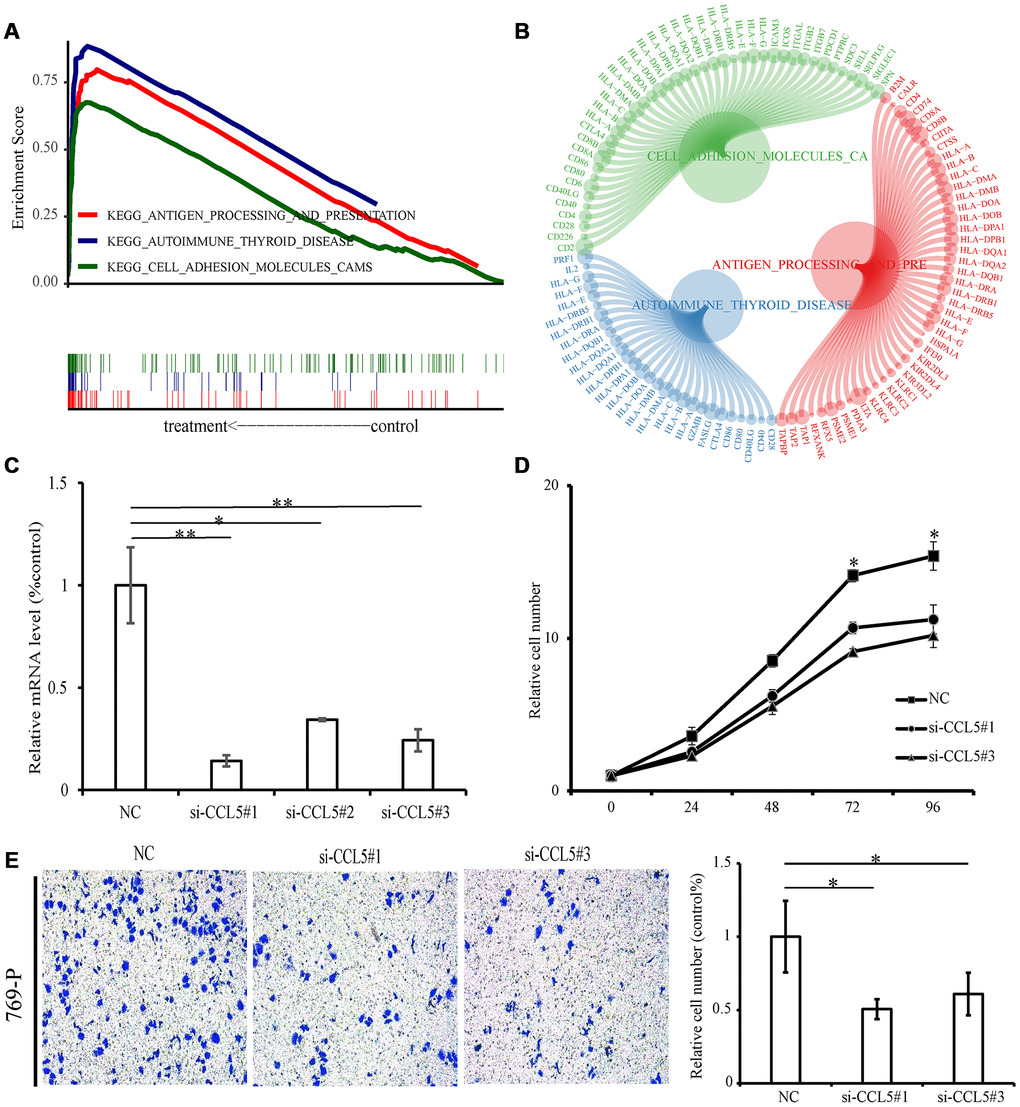
Figure 9.GSEA and experiment of CCL5. (A) The above picture shows the enrichment fractional broken line of the three pathways, and the lines in the lower figure correspond to the genes of each pathway. (B) The circle diagram shows three enrichment pathways and the core genes that play a role in the enrichment process. The larger the circle corresponding to each gene, the larger the rank metric score value. (C) The relative mRNA levels of normal control and si-CCL5 of 769-P cells. (D) The results of CCK-8 assay showed decreased proliferation ability of 769-P cells when treated with si-CCL5. (E) The invasion assay results showed decreased invasion ability of 769-P cells treated with si-CCL5.