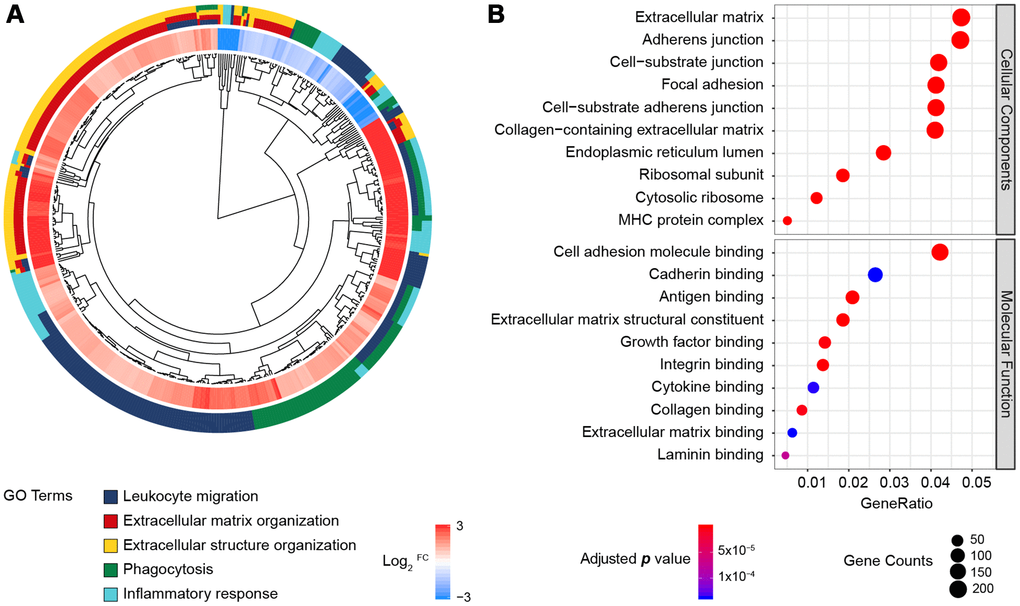
Figure 2.GO enrichment analysis of the DEGs from the RNA-Seq datasets of TCGA and GTEx. (A) GO Cluster. The inner dendrogram indicates the hierarchical clustering of the gene expression profiles, the outer circle represents the log2FC of each DEG, with the color corresponding to the gene level, and the outermost circle represents the GO BP terms assigned to the gene. (B) The 10 most significantly enriched CC and MF terms. The size of a circle indicates the number of enriched genes, and its color corresponds to the adjusted p value.