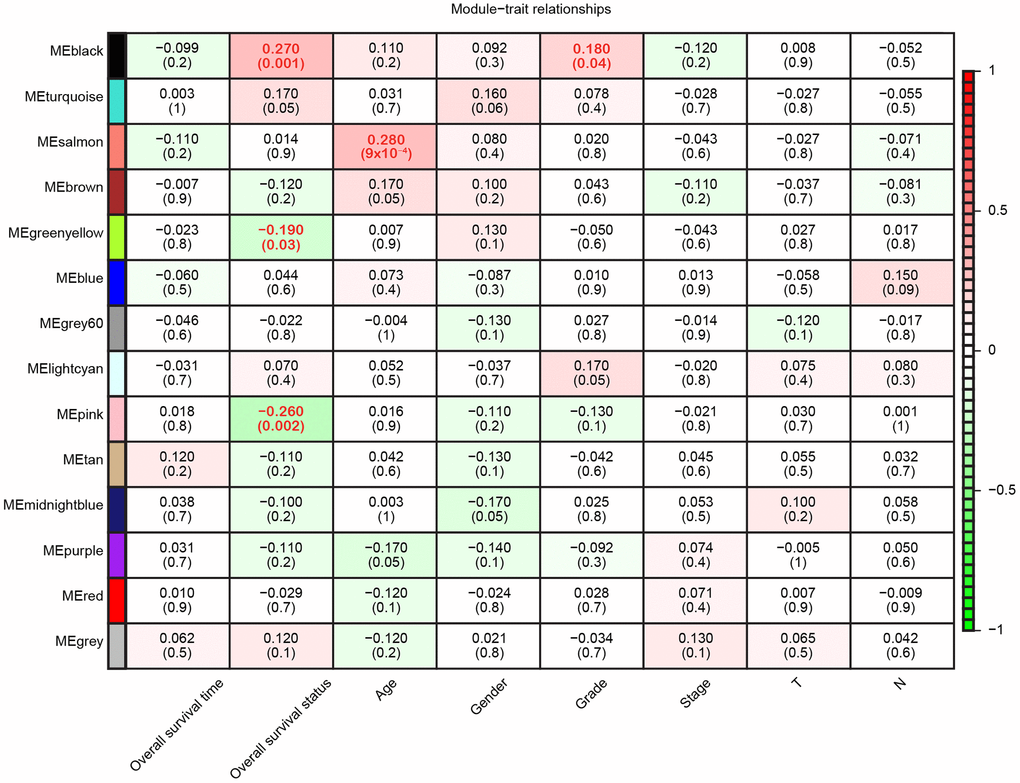
Figure 3.Module-trait relationships. Each row represents a color-coded module eigengene, each column represents a clinical trait, and each cell represents the Pearson correlation coefficient (top number) and p value (in parentheses) of the corresponding module-trait. The color of each cell indicates the degree of correlation, as shown in the key. Abbreviations: T, Primary tumor; N, Regional lymph nodes.