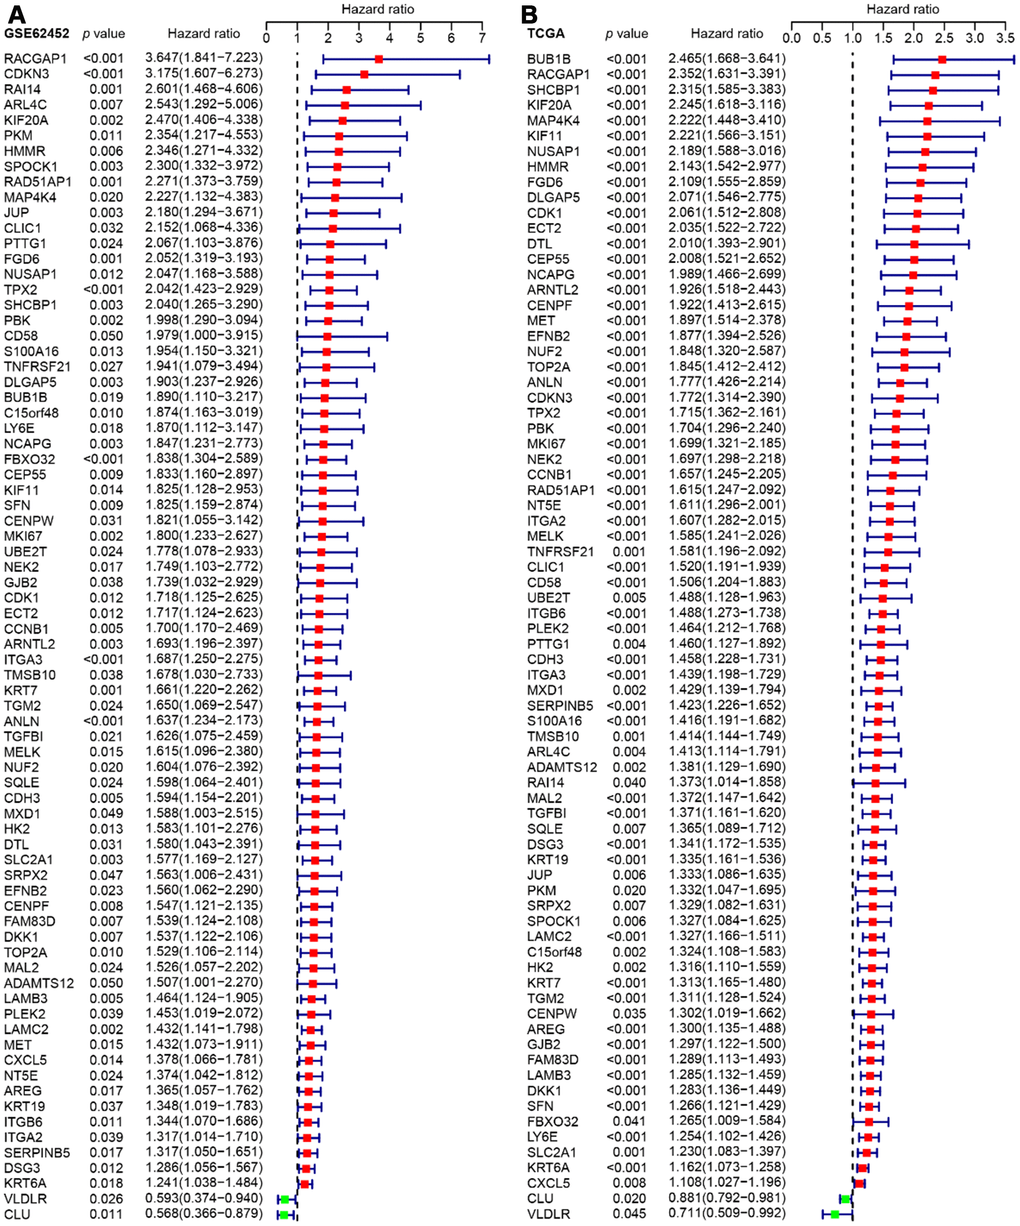
Figure 4.Forest plots visualizing the HRs of 76 prognostic DEGs identified by univariate Cox analysis of GSE62452 (A) and TCGA (B). The first three columns display the gene name, p value, and HR and 95% CI, respectively. In the forest plot, protective associations are shown in green and risk factors are shown in red.