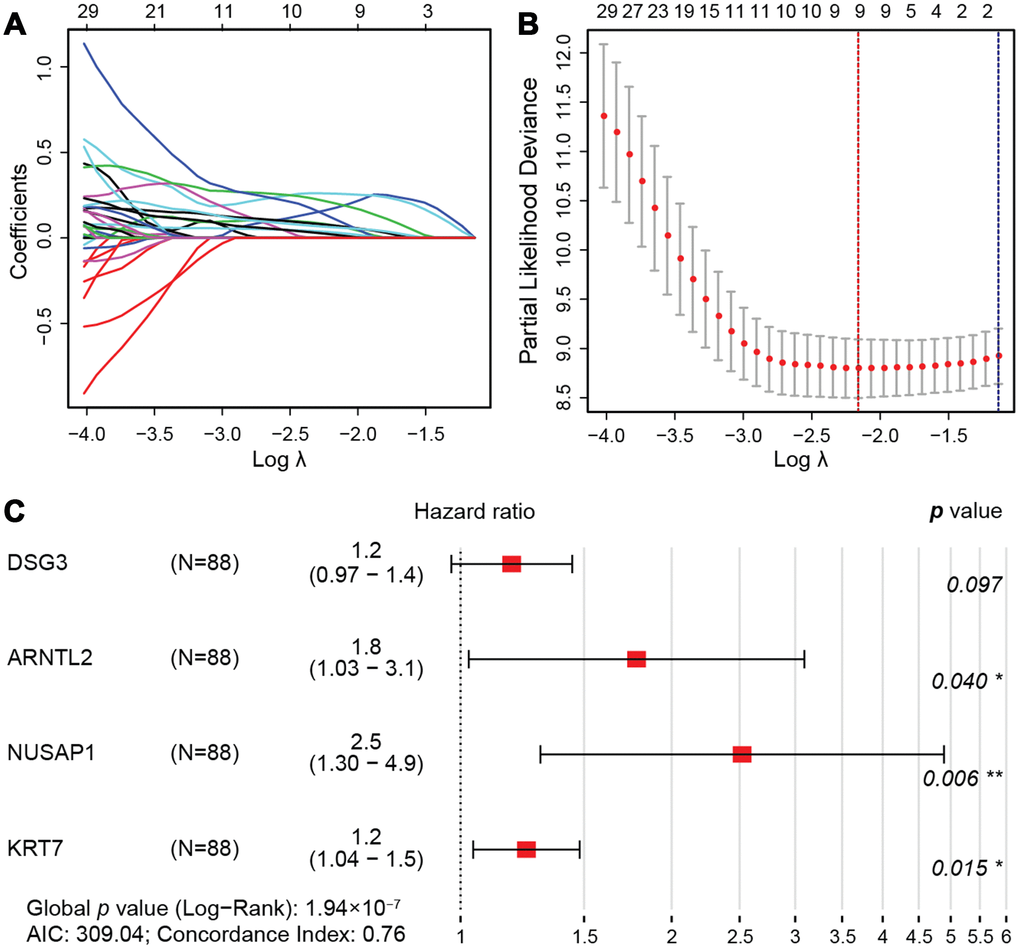
Figure 5.LASSO regression model. (A) LASSO coefficient profiles of the 76 prognostic DEGs. Each curve represents a coefficient, and the x-axis represents the regularization penalty parameter. As λ changes, a coefficient that becomes non-zero enters the LASSO regression model. (B) Cross-validation to select the optimal tuning parameter (λ). The red dotted vertical line crosses over the optimal log λ, which corresponds to the minimum value for multivariate Cox modeling. The two dotted lines represent one standard deviation from the minimum value. (C) HRs and 95% CIs of the four genes based on multivariate Cox regression analysis of the training cohort from TCGA.