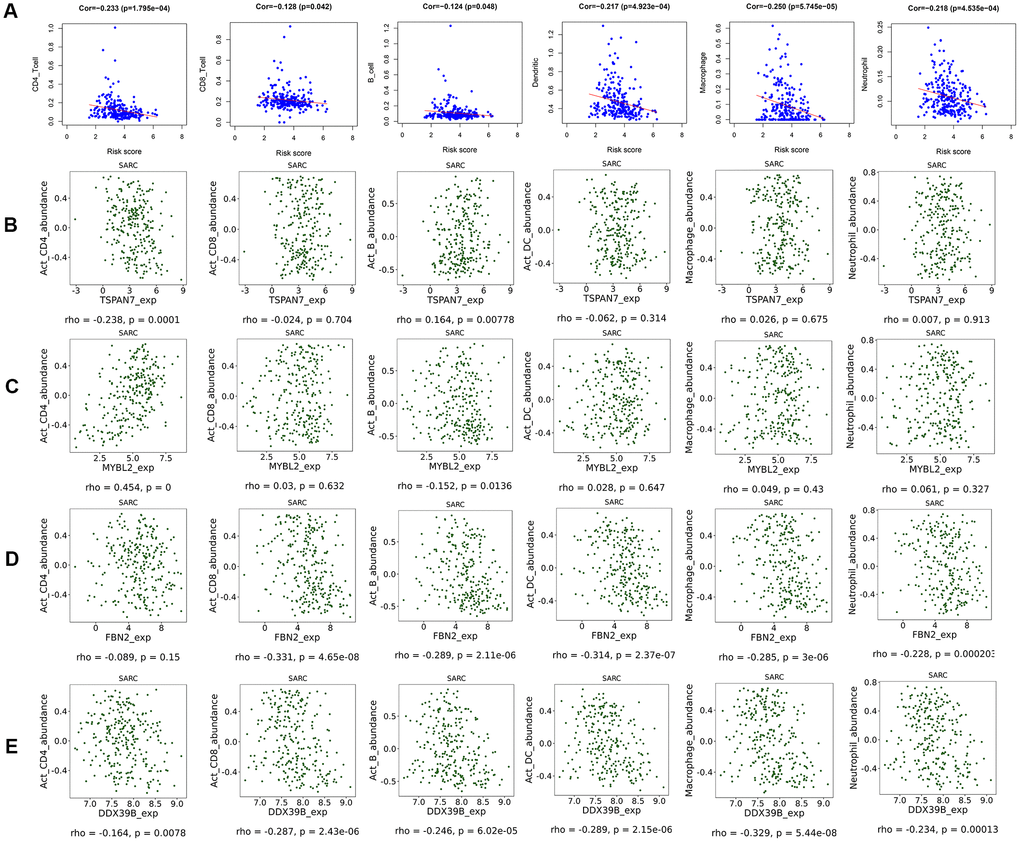
Figure 5.Scatter diagram of the relationship between immune cell infiltration, risk scores, and key gene expression. (A) Relationships between immune cell infiltration and risk scores. (B) Relationships between immune cell infiltration and expression of the TSPAN7 (B), MYBL2 (C), FBN2 (D), and DDX39 (E) genes.