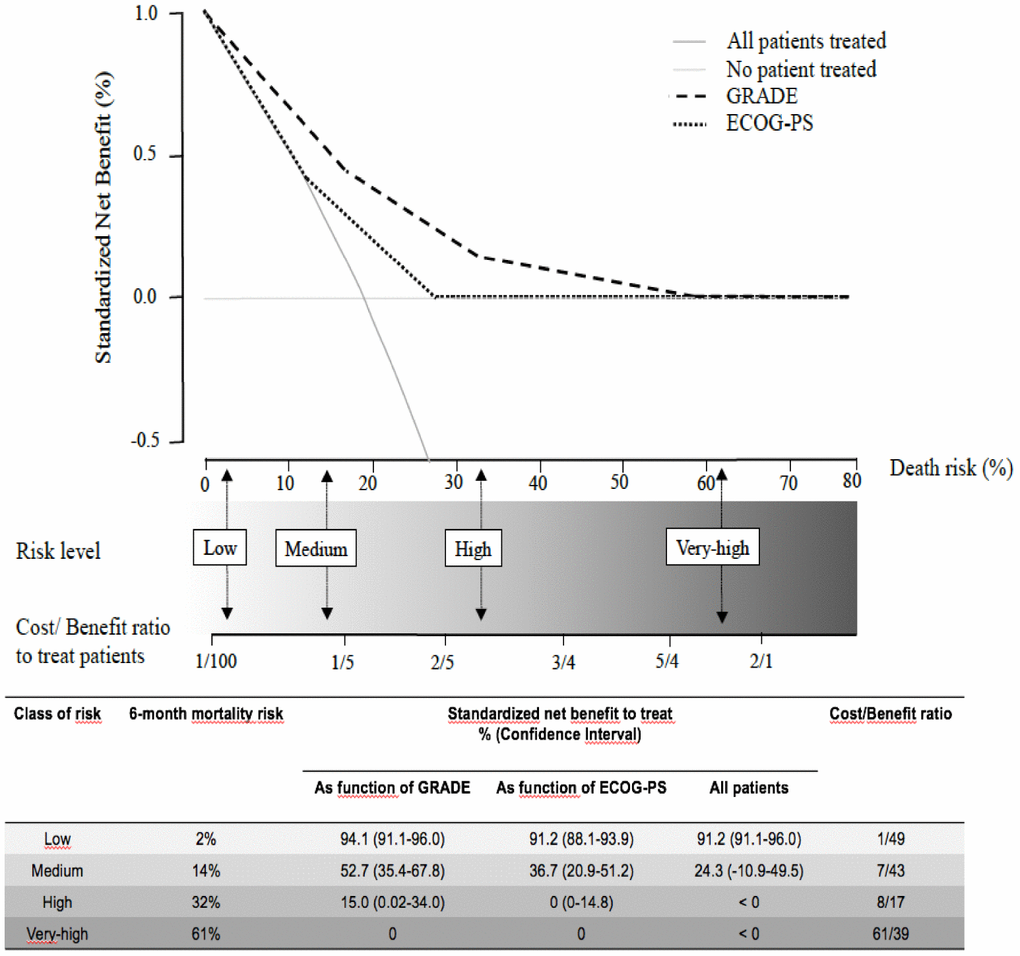
Figure 4.The decision curves show estimates of the SNB (%) over a range of probability thresholds used to categorize observations as “high risk”. The curves help to evaluate a treatment policy that recommends treatment for patients who are considered to be “high risk” by comparing the population impact of a risk-based policy to “treat all” (cross line in grey) and “treat none” (baseline) intervention policies. A model for prediction of early death (curves in black) according to ECOG-PS, and the GRADE. At a given risk threshold for early death, the graph gives the expected SNB per patient for “treat none”, “treat all”, and to treatment according to the ECOG-PS, and the GRADE, in relation to the related Cost/Benefit (C/B) ratio.