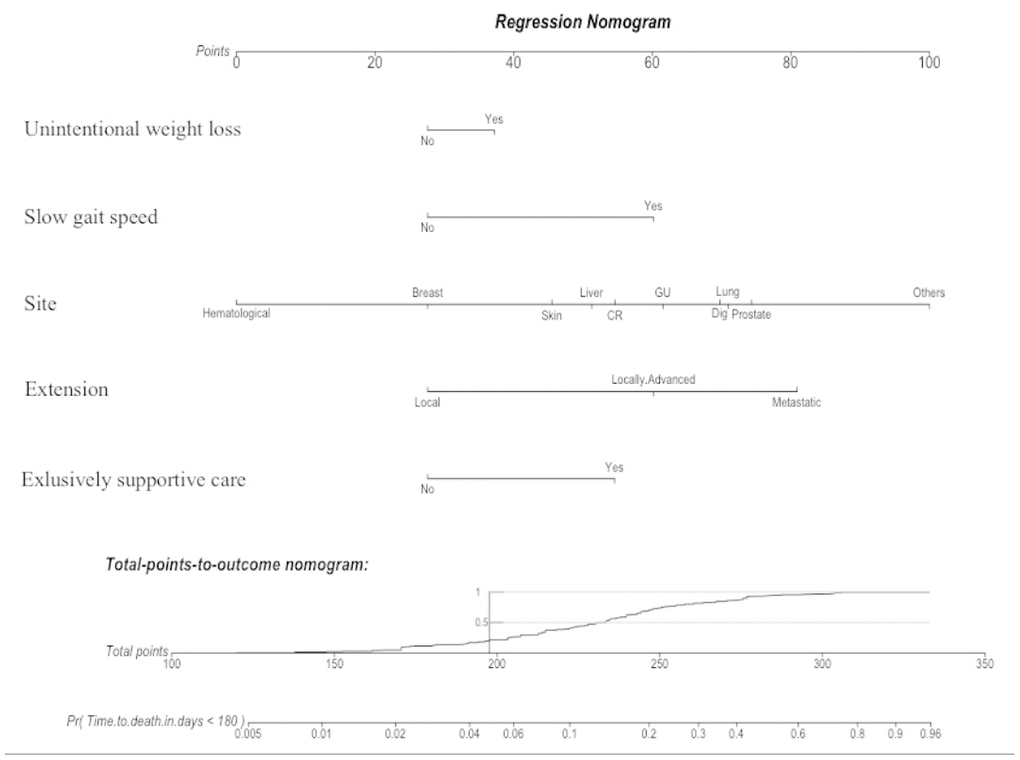
Figure 5.A nomogram is a graphical calculating device based on the results of a multivariate Cox regression. It is a quick way to interpret the 6-month mortality risk predicted by the multivariate Cox model. A numerical scale was created allocating scores for each predictor: Unintentional weight loss (“Yes”: 37; “No”: 28); Slow gait speed (“Yes”: 60; “No”: 28); Site (Hematological: “0”; Breast: “28”; Skin: “46”; Liver: “51”; CR: “55”; GU: “62”; Dig: “70”; Lung: “71”; Prostate: “74”; Other: “100”); Extension (Local: “28”; Locally-Advanced: “60”; Metastatic: “81”); and Exclusively supportive cares (“Yes”: 55; “No”: 28). The total score derived from all the covariates ranges from 112 to 333 points and indicates the probabilities (Pr) of dying in the 6-month follow-up. This device is available on the website: https://grade.shinyapps.io/dynnomapp/ Skin: skin with melanoma; CR: colorectal; GU: genito-urinary; Dig: digestive non-colorectal.