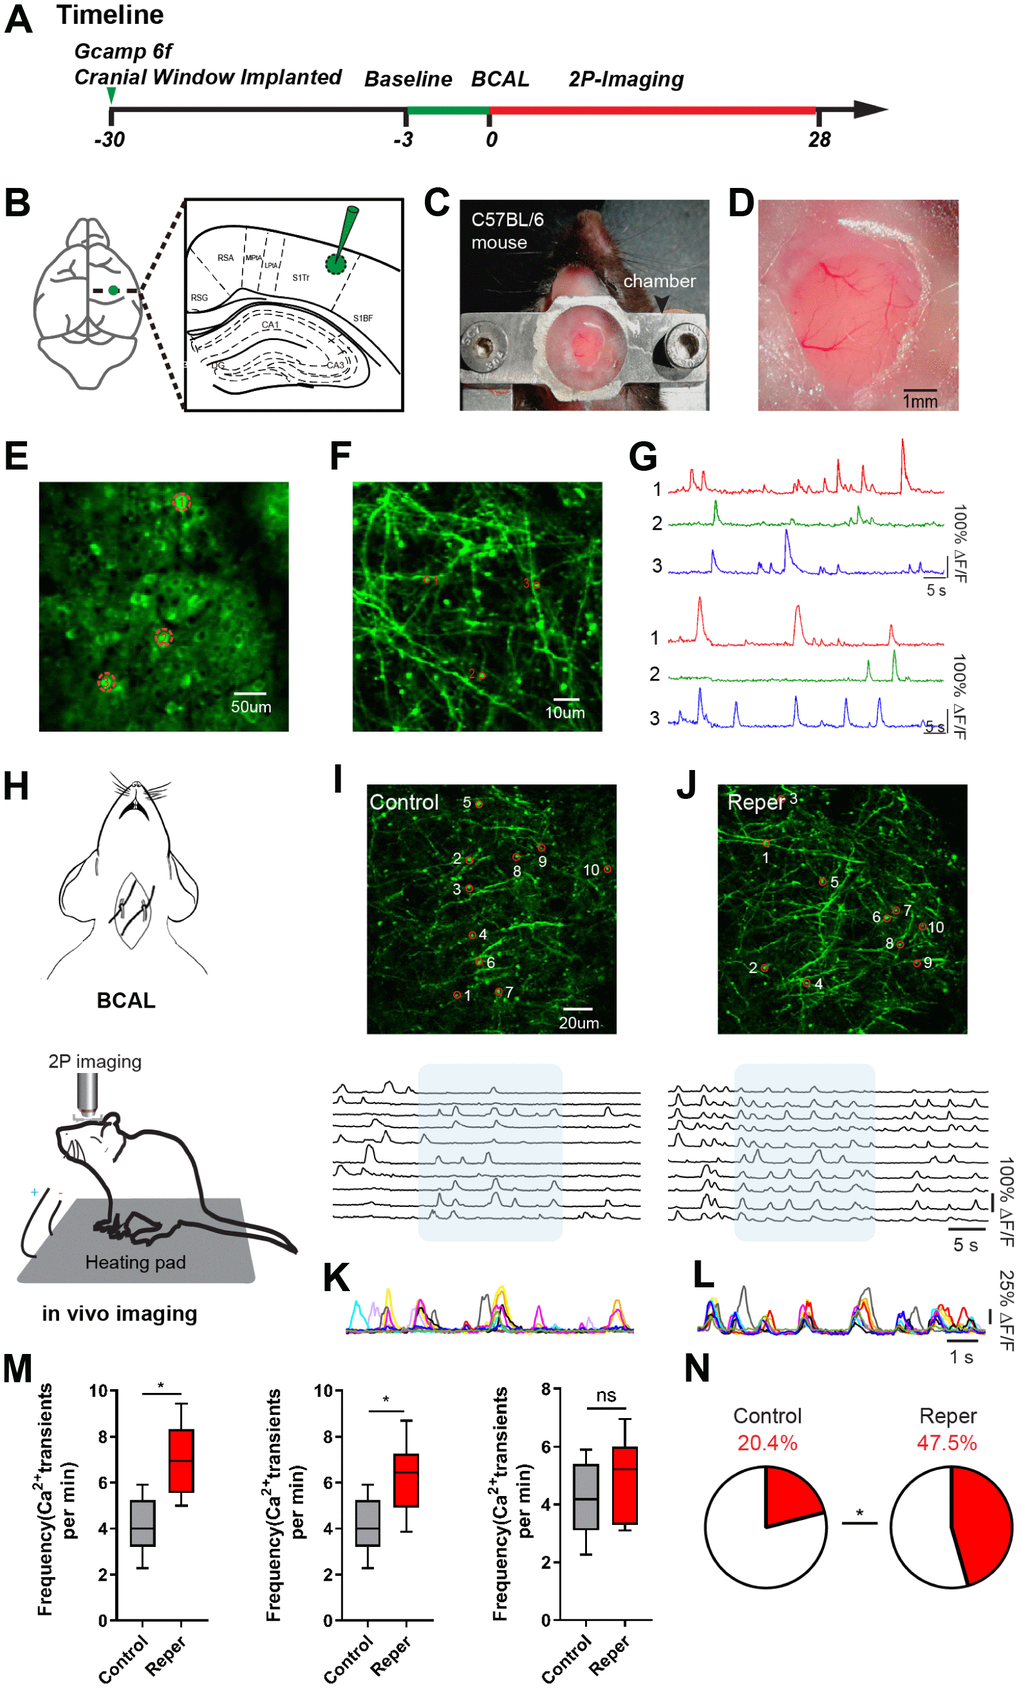
Figure 1.Transient ischemia-reperfusion induces cortical hyperactivity. (A) Timeline of the experiment. Green arrow, virus injection time; the green line and red line indicate the two-photon imaging time course. (B) Virus injection sites. (C) Chamber for chronic two-photon imaging. (D) Picture of the craniotomy window. (E, F) Layer 2/3 cortical neurons and layer1 spines images. The red circle represents the selected somata (E) and spine (F). (G) The spontaneous Ca2+ transients of neurons and spines in (E, F) maps. (H) Experimental methods for inducing ischemia and for in vivo imaging. (I, J) Top, layer 1 (30~50 um) spines imaged in vivo on the 3rd day after reperfusion, where the red circle represents the selected spine in control (I) and Reper (J) mice. Bottom, the traces of selected spines. (K, L) Superimposed traces from the shaded areas in i and j. Each color represents a different cell. (M) The average frequencies of Ca2+ transients in control and Reper mice. The 3rd hour (left, n=395 spines in 5 controlmice, 438 spines in 6 Reper mice), the 3rd day (middle, n= 405 spines in 5 control mice, 432 spines in 6 Reper mice) and the 14th day (right, n= 397 spines in 5 control mice, 436 spines in 6 Reper mice). (N) The fractions of hyperactive spines in control mice (n= 405 spines) and Reper mice (n= 432 spines) on the 3rd day after reperfusion. *P < 0.05, ns, not significant, Student’s t-test. Error bars = s.e.m.