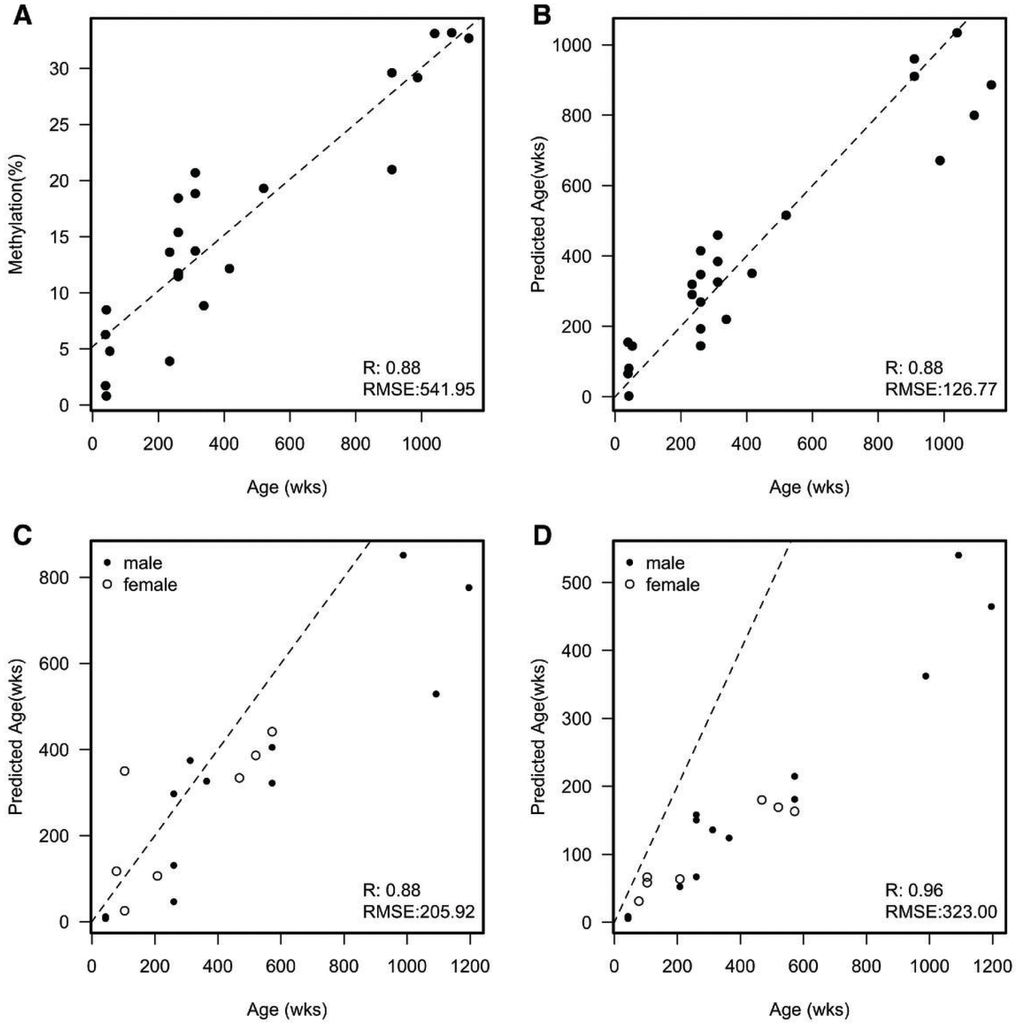
Figure 1.(A) Example of a single CpG that correlates with the age of each naked mole-rat. Dashed line is a fitted linear model; RMSE = Root Mean Square Error. Mean absolute deviation (MAD) = 412.282 and median absolute error (MAE) = 400.198; (B) A scatterplot of the predicted age of each naked mole-rat liver sample against the actual age in weeks from an initial sample set. The predicted age was calculated by removing the sample and fitting to the remaining samples. Dashed line represents y=x (e.g. perfect prediction). MAD = 96.882 and MAE = 120.840; (C) A scatter plot of the predicted age of a second set of naked mole-rat livers against the actual age in weeks. Dashed line represents y=x (e.g. perfect prediction). MAD = 118.941 and MAE = 126.883; (D) A scatter plot of the predicted age of skin samples against the actual age in weeks. Dashed line represents y=x (e.g. perfect prediction). MAD = 219.113 and MAE = 252.874.