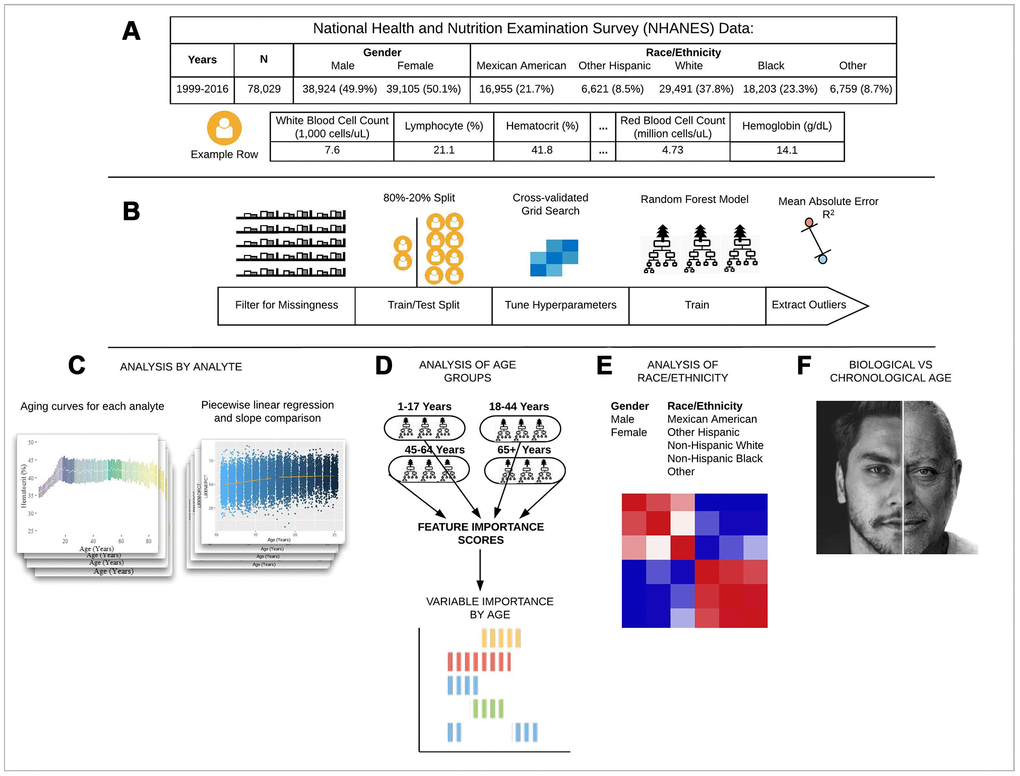
Figure 1.Schematic overview of our study. (A) The CDC NHANES datasets from 1999-2016 (N refers to size before filtering) were used in our analyses; shown are summary statistics and an example row for a single individual in the dataset. (B) An overview of the machine learning pipeline used in the study. We filtered on a set missingness criteria (Methods) and then separated individuals into an 80/20 train/test split. We used a random forest model with hyperparameters tuned using a cross-validated grid search. After training the model we tested using cross-validation and the 20% held-out test set and analyzed outliers. (C) Aging curves for individual analytes were computed and analyzed for linear and non-linear trends. Piecewise regression analysis and breakpoint estimation were used to estimate breakpoints and compare slopes separated by breakpoints. (D) Models were trained separately for four U.S. Census age groups and feature importance scores were computed for each age group. (E) Models were trained on subgroups of the dataset separated by race and gender. The feature importance scores were calculated for each model and compared across race/gender groups. (F) Analyses of the trajectories of analytes across age ranges were used to compare chronological vs. biological definitions of age.