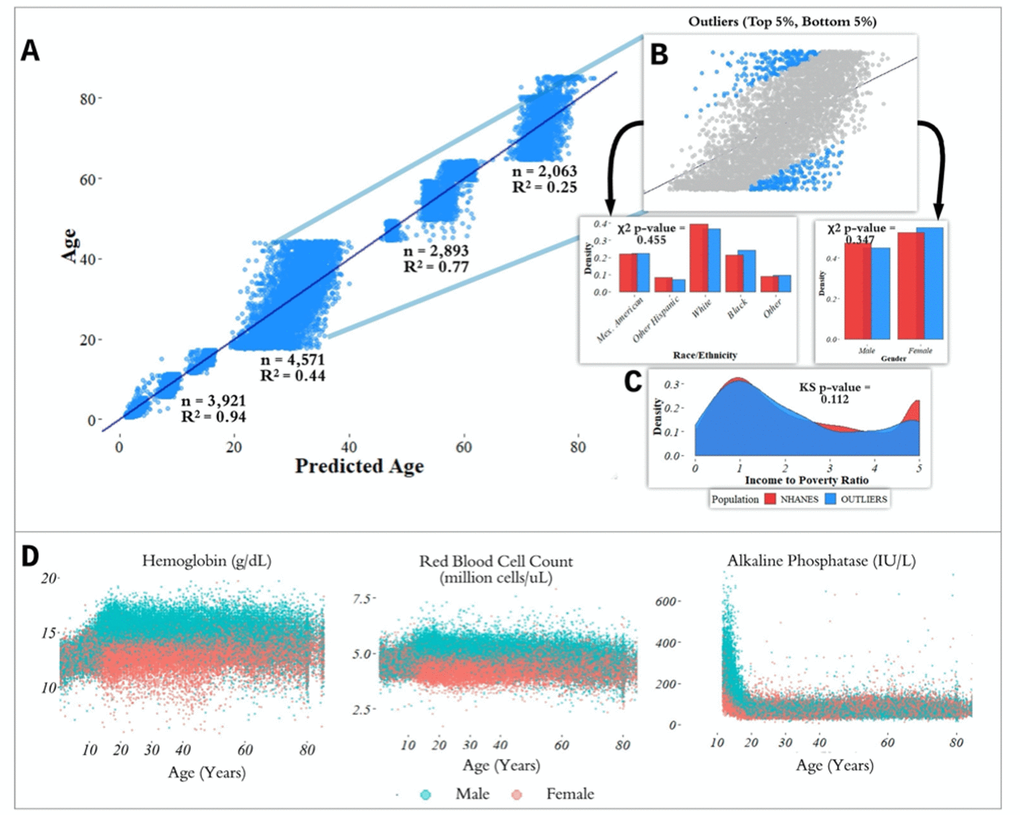
Figure 2.Performance of prediction model across age groups. (A) Actual age vs. predicted age from the random forest model with R2 and sample size (n) for each age range in the test set. (B) Observations with a residual error falling in the top 5% or bottom 5% were identified and compared to the overall NHANES population. (C) Gender, race, and income to poverty ratio distributions were compared between outliers and the overall NHANES population. (D) Analyte levels by age, colored by gender. Hemoglobin, red blood cell count, and alkaline phosphatase were selected to represent contrasting patterns in the separability of males and females at different age ranges.