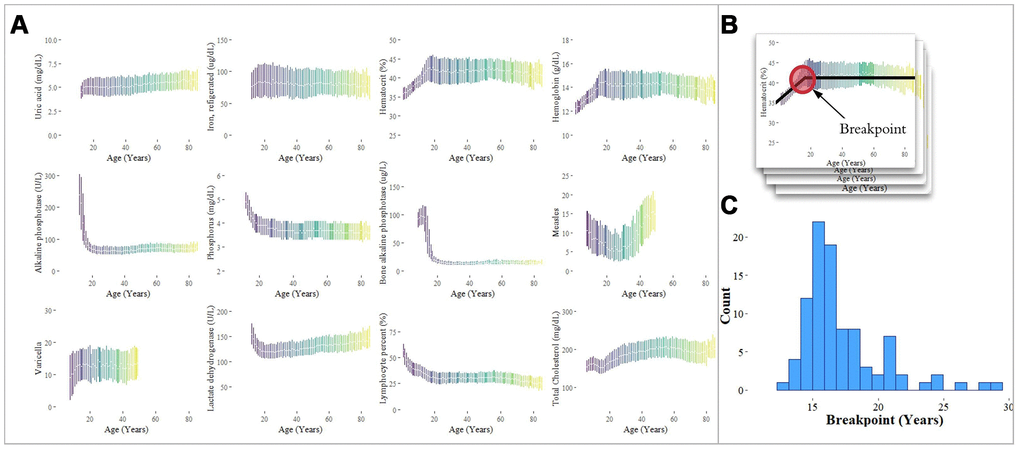
Figure 5.Analysis of individual analytes for linear and non-linear trends. (A) Laboratory analytes exhibit clear linear and non-linear trends with respect to age. The interquartile ranges of analyte values, plotted by age, are shown for selected analytes. Analytes were selected from our analysis of the Top-10 feature importance scores for each age group, and exhibit linearity, piecewise linearity, power, and U-shaped curves. (B) Breakpoints were estimated using piecewise linear regression. (C) The distribution of breakpoints for 94 analytes with a significant difference in slope around the breakpoint is shown with a median estimated breakpoint of 16.4 years.