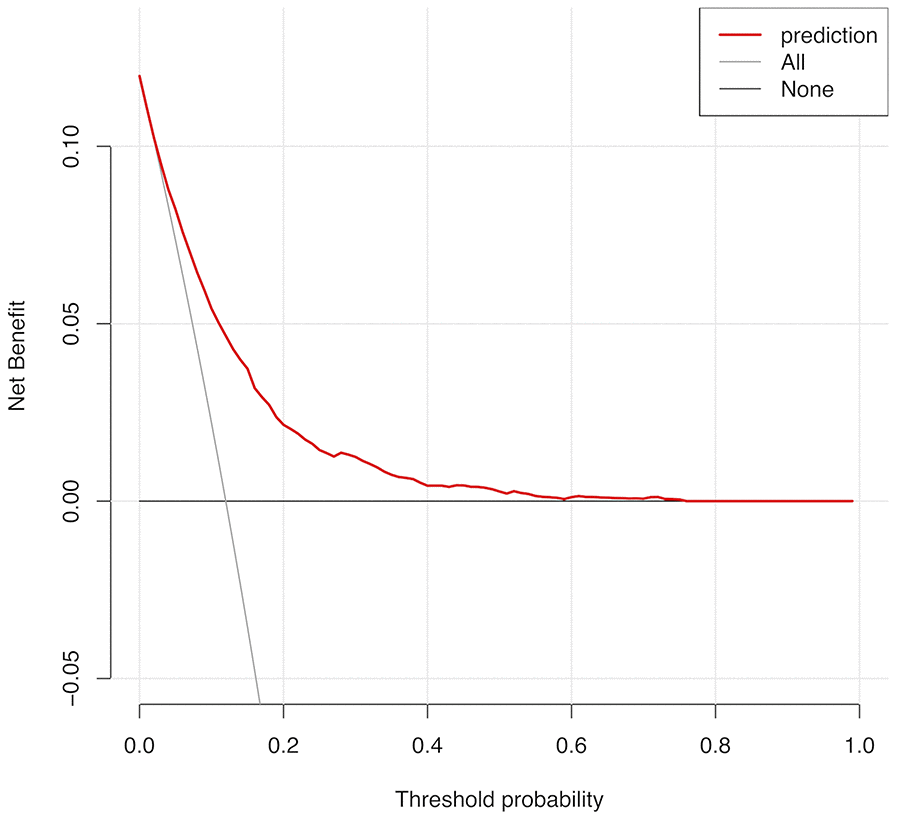
Figure 5.Decision curve analysis for CRLNI in PTMC patients. The y-axis represents the net benefit. The red line represents the nomogram of CRLNI. The grey line displays the assumption that all patients have CRLNI. The black line represents the assumption that no patients have CRLNI. The decision curve showed that predicting the CRLNI risk applying this nomogram would be better than having all patients or none patients treated by this nomogram with a range of the threshold probability between >1% and <75.