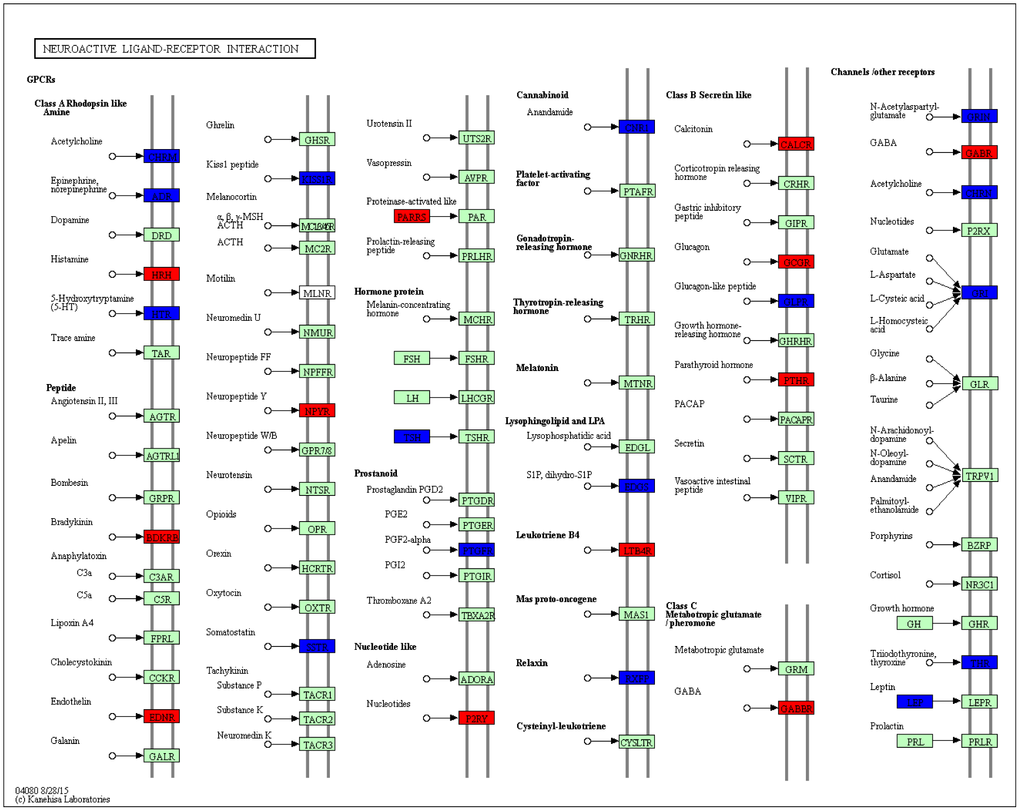
Figure 7.KEGG pathway map showing change of neuroactive ligand-receptor interaction. DEGs with relatively increased and reduced expression were shown in red and blue, respectively, while green represented background genes. KEGG pathway only at week 4 was showed.