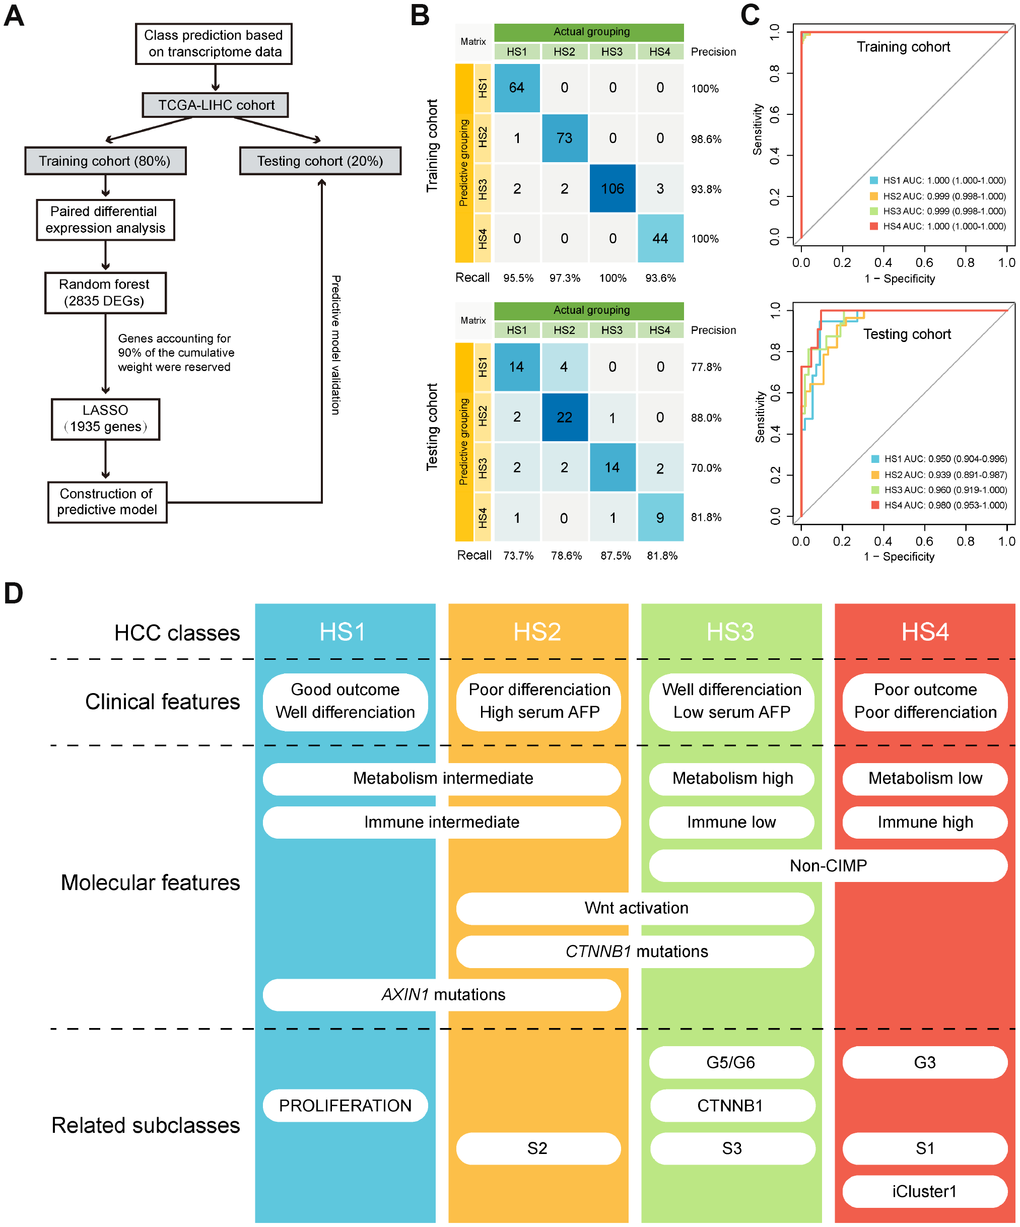
Figure 6.Class prediction of HCC patients. (A) Flow chart shows the process of prediction model construction. (B) Confusion matrix evaluations of prediction model within the training cohort and testing cohort. A perfect prediction model (100% accuracy) have 0 counts for all non-diagonal entries (that is, no misclassified samples). (C) ROC curves in training and testing cohort depict trade-offs between true and false positive rates as classification stringency varies. AUC values close to 1 indicate that a high true positive rate was achieved with low false positive rate, while AUC values close to 0.5 indicate random performance. (D) Overview of the characteristics of 4 HCC subclasses. HCC: hepatocellular carcinoma; ROC: Receiver operating characteristic; AUC: Area under the curve.