Submit an Article
Navigate
Home
Editorial Board
Editorial Policies
Current Volume
Archive
Scientific Integrity
Publication Ethics Statements
Interviews with Outstanding Authors
Newsroom
Sponsored Conferences
Podcast
Contact
Special Collections
Submit an Article
Online ISSN: 1945-4589
Research Paper
|
Volume 12, Issue 6
|
pp. 4996–5009
Identification of survival-associated alternative splicing events and signatures in adrenocortical carcinoma based on TCGA SpliceSeq data
Back to article
Figure 4
(4 of 8)
−
100%
+
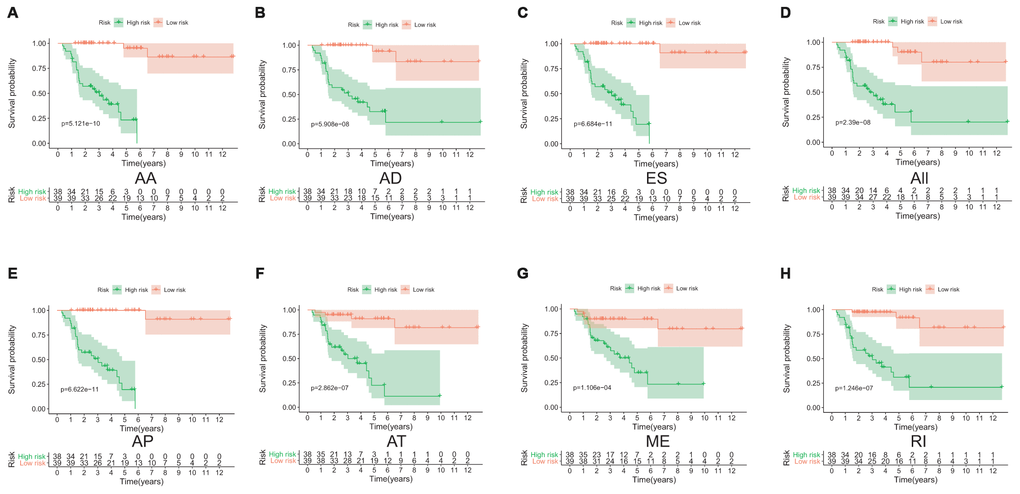
Figure 4.
The Kaplan-Meier curves analysis of overall survival between the low-risk patients and high-risk patients.
AA cohort (
A
), AD cohort (
B
), ES cohort (
C
), the whole cohort (
D
), AP cohort (
E
), AT cohort (
F
), ME cohort (
G
) and RI cohort (
H
).