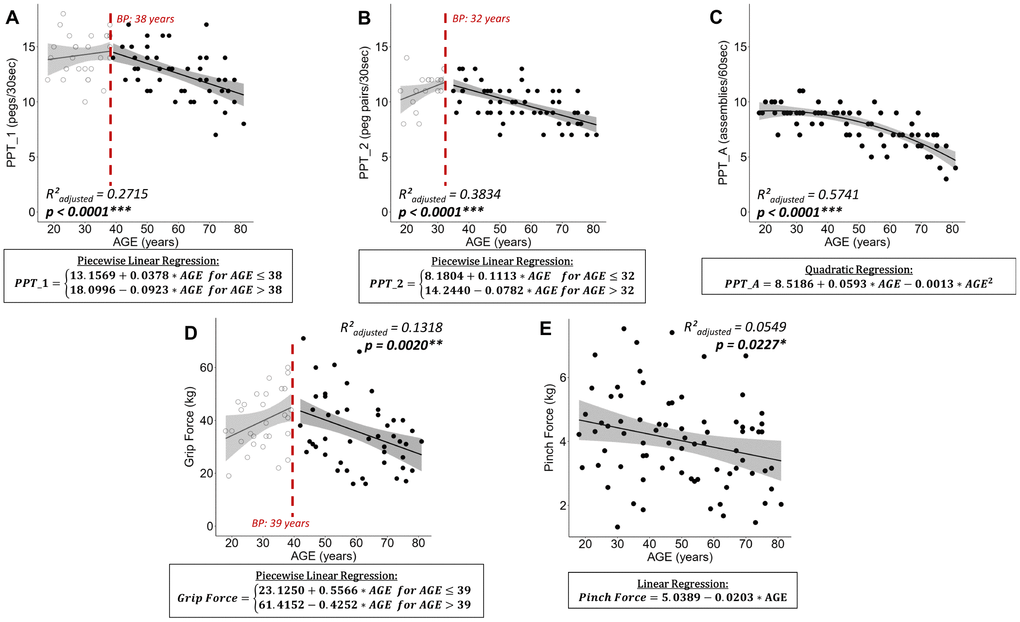
Figure 1.Plots of best fitting regression models for changes in sensorimotor performance over the lifespan. For piecewise linear regressions the breakpoint (BP) is indicated. (A) Purdue Pegboard Test unimanual peg placement with the dominant hand (PPT_1), (B) Purdue Pegboard Test peg placement with both hands (PPT_2), (C) Purdue Pegboard Test assembly task (PPT_A), (D) maximal Grip Force, and (E) maximal Pinch Force. For piecewise linear regressions, data points below and above the breakpoint are represented by open and filled points, respectively. Below each plot the best fitting regression model is stated in a rectangle. Ribbons depict the 95% confidence interval of the fit. Significant p-values are indicated with asterisks (*** p < 0.001; ** p < 0.01; * p < 0.05) and printed in bold.